Operations teams have 12 core workflows where AI agents replace manual coordination, triage, and reporting, from incident response to compliance prep. If you haven't automated at least half of these, you're spending engineering time on work that should run itself.
TL;DR
- AI agents handle incident triage, reporting, and coordination without manual handoffs.
- The 12 workflows split into monitoring, reporting, and coordination/compliance categories.
- Start with the 3 highest-frequency workflows first; track MTTR and report time saved.
Table of Contents
- What AI Agent Workflows Actually Mean for Operations
- Monitoring, Alerting, and Incident Response (Workflows 1–4)
- Reporting, Documentation, and Status Updates (Workflows 5–8)
- Coordination, Escalation, and Compliance (Workflows 9–12)
- How to Prioritize the Twelve
- What to Measure After You Deploy
What AI Agent Workflows Actually Mean for Operations
An AI agent workflow isn't a Zapier trigger, a monitoring alert rule, or a chatbot that answers questions. IBM defines agentic AI as a system "capable of autonomously performing tasks on behalf of a user or another system by designing its workflow and using available tools." For operations teams, the operative word is autonomously: the agent doesn't wait for a human to hand it each next step.
What distinguishes an agent workflow from a script or a rule: it spans multiple tools, makes conditional decisions based on live context, and acts on the results without a human in the loop at each handoff. Scripts execute fixed instructions; agent workflows adapt to what the monitoring data actually says. If you're working through whether agents make sense for your stack versus traditional automation tools, AI Agents vs. Automation Tools: Which Does Your Business Actually Need? covers the decision framework directly.
For operations teams, that distinction changes what's possible. Until recently, monitoring and response were separate systems: alerts reached humans, humans took action. The agent layer connects them without requiring custom code per workflow.
The operational shift:
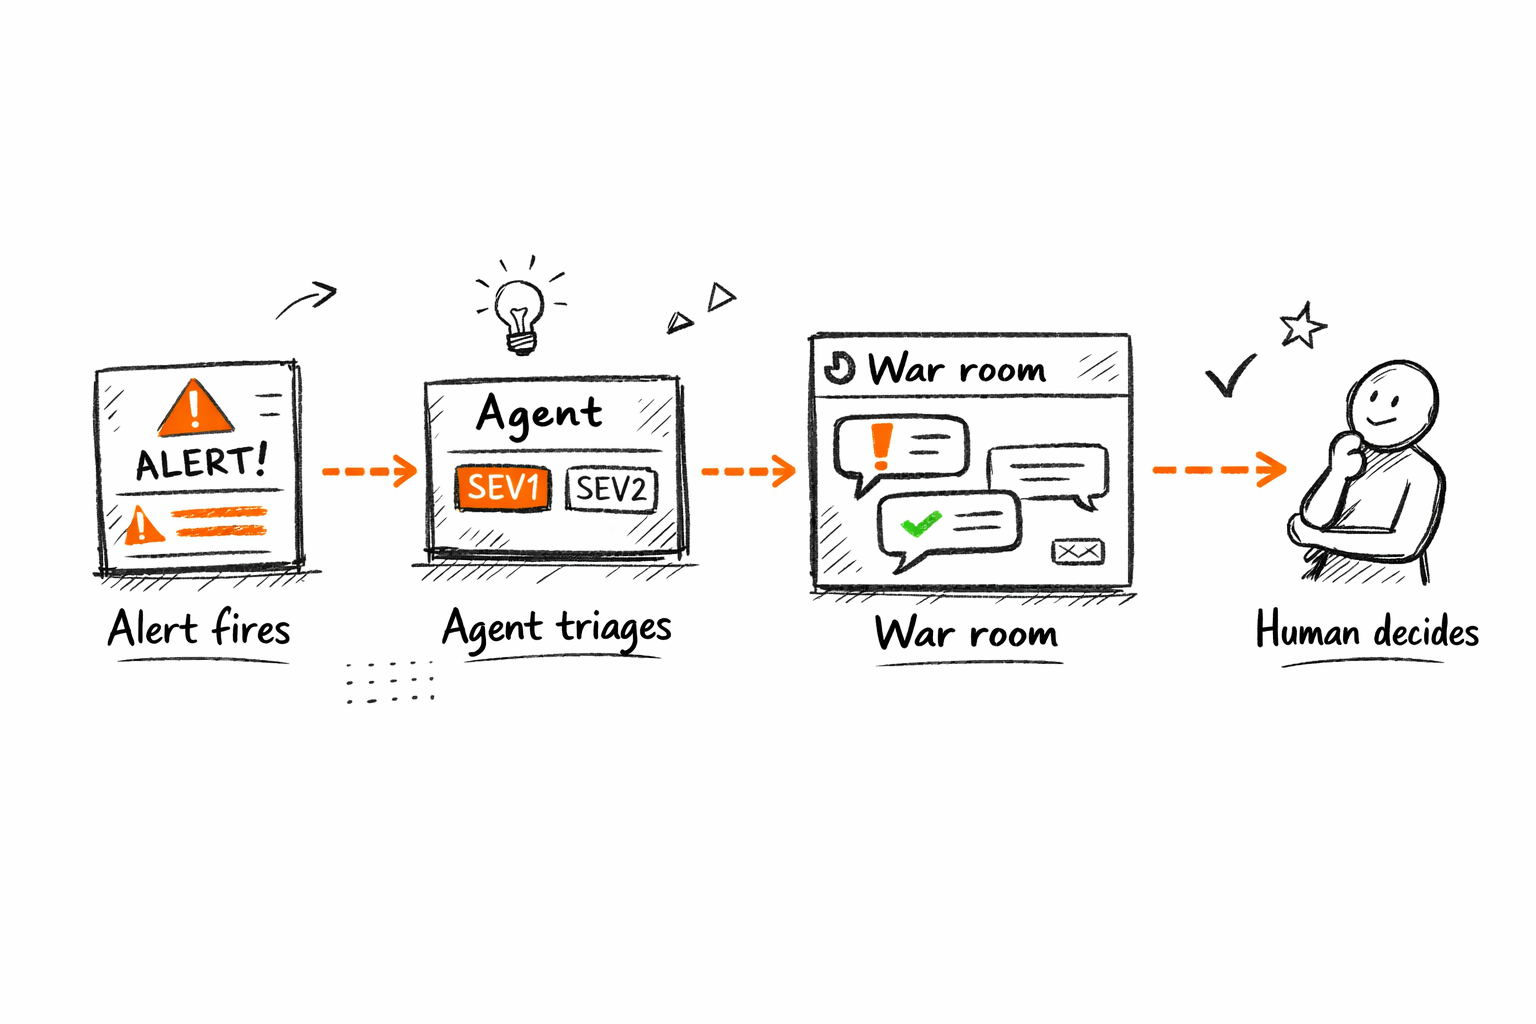
Traditional: Alert fires → on-call reads → classifies severity → routes to team → posts context manually → team responds
Agent-driven: Alert fires → agent classifies severity → routes to correct team → posts context thread with history → on-call makes the decision
The engineer's role changes from coordinator to decision-maker. The agent handles everything before the decision. That's the shift.
It's possible now because LLMs with tool-calling (connected to Slack, PagerDuty, Jira, GitHub, Datadog) make multi-step execution viable without custom code per workflow. The integrations existed before. The agent layer is what connects them into an autonomous sequence. McKinsey's State of AI research has found IT and operations among the business functions where AI delivers measurable efficiency gains. The workflows below are where those gains are largest.
The 12 workflows group into three categories: monitoring and incident response, reporting and documentation, and coordination and compliance. They're not the only workflows worth automating. They're the twelve where manual load is highest and agent replacement is most direct.
| Workflow area | Manual process | AI agent process |
|---|---|---|
| Incident triage | On-call reads alert → decides severity → routes → posts context manually | Agent classifies severity → routes to correct team → opens Slack thread with history |
| Status reporting | Ops lead pulls metrics → formats doc → distributes (2–4 hrs/week) | Agent pulls data → formats → distributes in under 5 minutes |
| Ticket escalation | Manager checks queue → chases stale tickets → manually re-routes | Agent monitors queue → escalates on schedule with context attached |
Agents don't reduce operational workload. They change who does it. The engineer moves from coordinator to decision-maker.
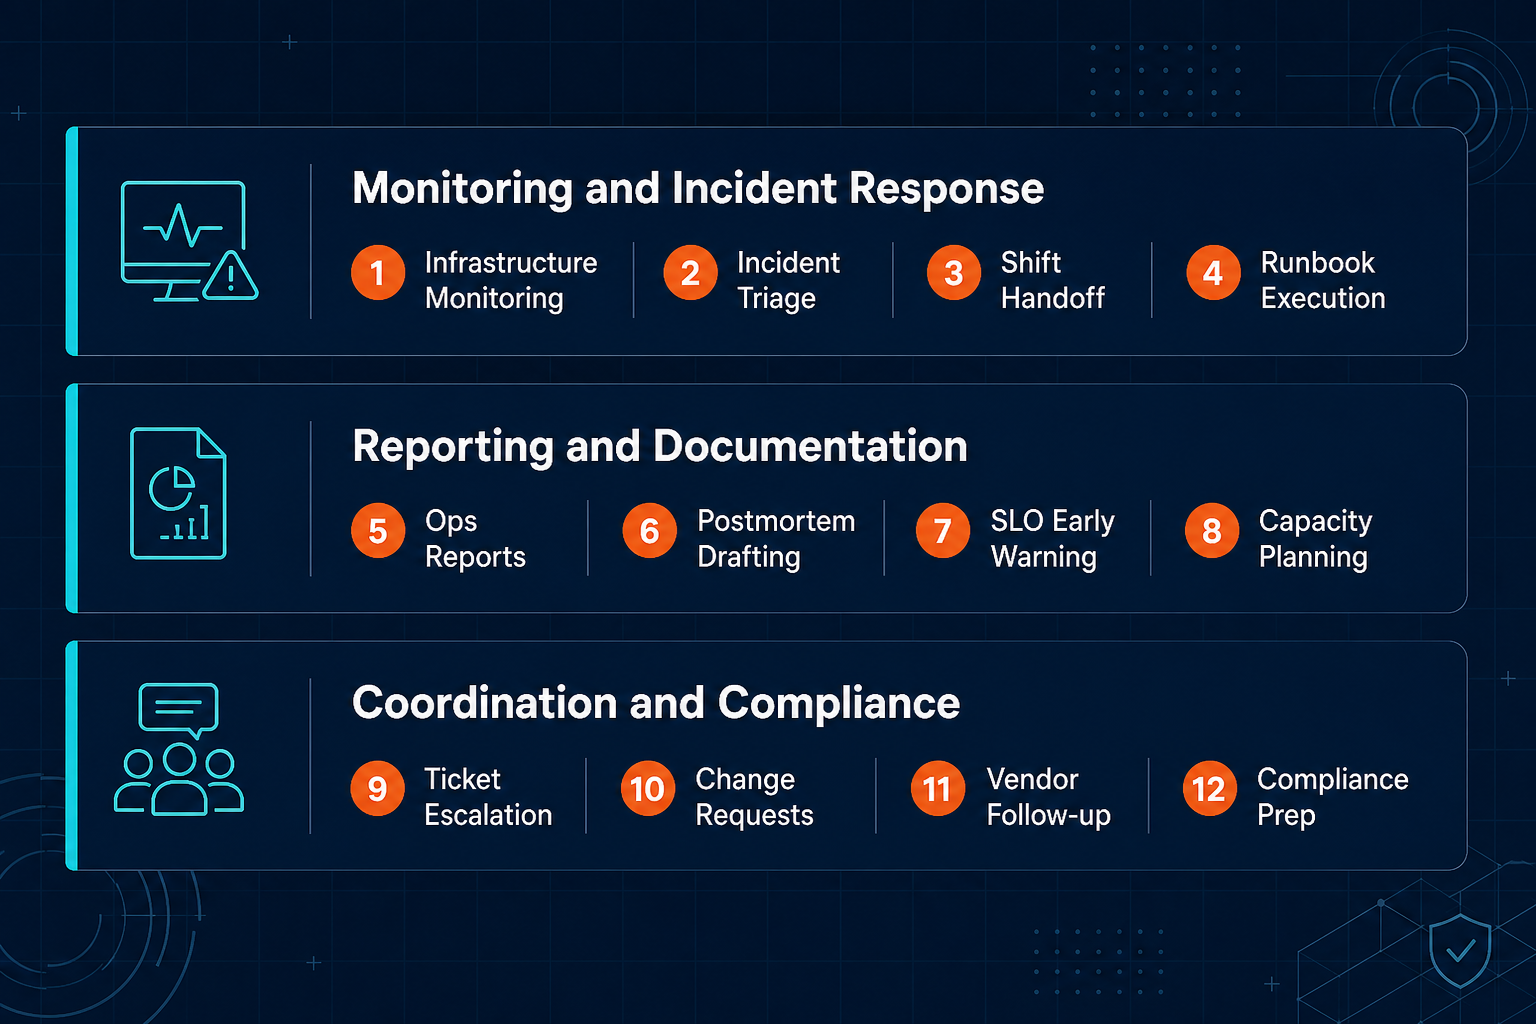
Monitoring, Alerting, and Incident Response (Workflows 1–4)
Incidents are where the most coordination overhead lives in operations. When an alert fires, what happens next is where time is lost: classifying severity, pulling context, routing to the right team. These four workflows automate that sequence so the engineer starts solving instead of coordinating.
Workflow 1: Infrastructure Health Monitoring
The baseline case: your monitoring stack already fires alerts. The agent upgrade is what happens with that alert. Instead of a raw threshold notification, the agent composes a rich-context message: graph snapshot, threshold detail, affected services, suggested first action, and a flag if similar incidents have appeared recently. The on-call engineer receives the context they need to act before the SLA clock starts.
Tool chain: Datadog / Prometheus / CloudWatch → agent → Slack / PagerDuty What it replaces: Engineers watching dashboards; reactive breach alerts with minimal context Key metric: Mean time to detect (MTTD): week 1 baseline vs. week 4
Workflow 2: Incident Triage and First Response
When an alert fires, someone has to classify its severity, decide which team owns it, and post enough context for that team to start working. Done manually, this takes several minutes per incident, longer during high-volume periods when the on-call engineer is already stretched across multiple open threads.
An agent does the same triage automatically: it checks severity classification against historical incident patterns for this service, routes the page to the correct team (not just the generic on-call rotation) and opens a Slack war-room thread with the affected service, recent deployments in the window, error rate trend, and links to similar past incidents. The routing work is done before anyone on the team opens their phone.
Tool chain: PagerDuty + GitHub + Jira → agent → Slack What it replaces: On-call engineer manually reads, classifies, routes, and posts context Key metrics: MTTR; first-routing accuracy (% incidents routed correctly on first pass)
For a full implementation walkthrough, see How to Automate Incident Response with AI Agents.
The latency in incident response isn't resolution time. It's routing time: the gap between alert firing and the right person acting on it.
Workflow 3: On-Call Shift Handoff Documentation
Shift handoffs are where incident context dies. The outgoing on-call is exhausted; the incoming on-call has no structured record of what happened, what's still open, or what's at risk of failing. The agent fixes this without adding any work for either engineer.
Before each shift change, the agent pulls the last 8-hour incident timeline from PagerDuty and the relevant Slack threads, structures it into a handoff doc (open incidents, in-progress investigations, services under watch, known fragile points) and posts it to the handoff channel with a ping to the incoming on-call. The handoff is complete whether or not the outgoing engineer has time to write one.
Tool chain: PagerDuty + Slack → agent → Slack / Confluence What it replaces: Outgoing on-call writes a manual summary, if they write one at all Key metrics: Handoff completion rate (target: 100%); incoming on-call time to first action
Workflow 4: Runbook Step Execution
Runbooks exist for the scenarios that repeat: disk full, certificate expiry, memory leak, pod crash loop. The steps are documented. Executing them manually under pressure is where errors happen: copy-paste mistakes, skipped steps, missing audit logs.
An agent executes the safe steps (restart the service, flush the cache, scale the deployment) and logs each action with a timestamp and the result. At any step requiring human approval (a production database change, a rollback), it pauses and waits. The audit trail is complete without anyone maintaining it. The engineer's attention stays on the decision that only they can make. For how to design those approval boundaries without creating throughput bottlenecks, see Human-in-the-Loop AI Automation: Designing Oversight Without Killing Throughput.
Tool chain: Runbook store → agent → target system API + Slack + audit log What it replaces: Engineer opens runbook, manually copies and executes commands, logs actions manually Key metrics: Mean time to remediate (MTTR); step-execution error rate
Reporting, Documentation, and Status Updates (Workflows 5–8)
Reporting is one of the highest-load, lowest-leverage activities in operations. The data exists. The format is consistent. The distribution list doesn't change. Every hour an ops lead spends assembling a report is time they're not acting on what the report reveals. These four workflows eliminate that tax entirely.
Workflow 5: Daily and Weekly Ops Status Reports
The weekly ops report is a fixed cost: same data sources, same format, same stakeholders, every week. The only variable is how long it takes, and manually it compounds across the week.
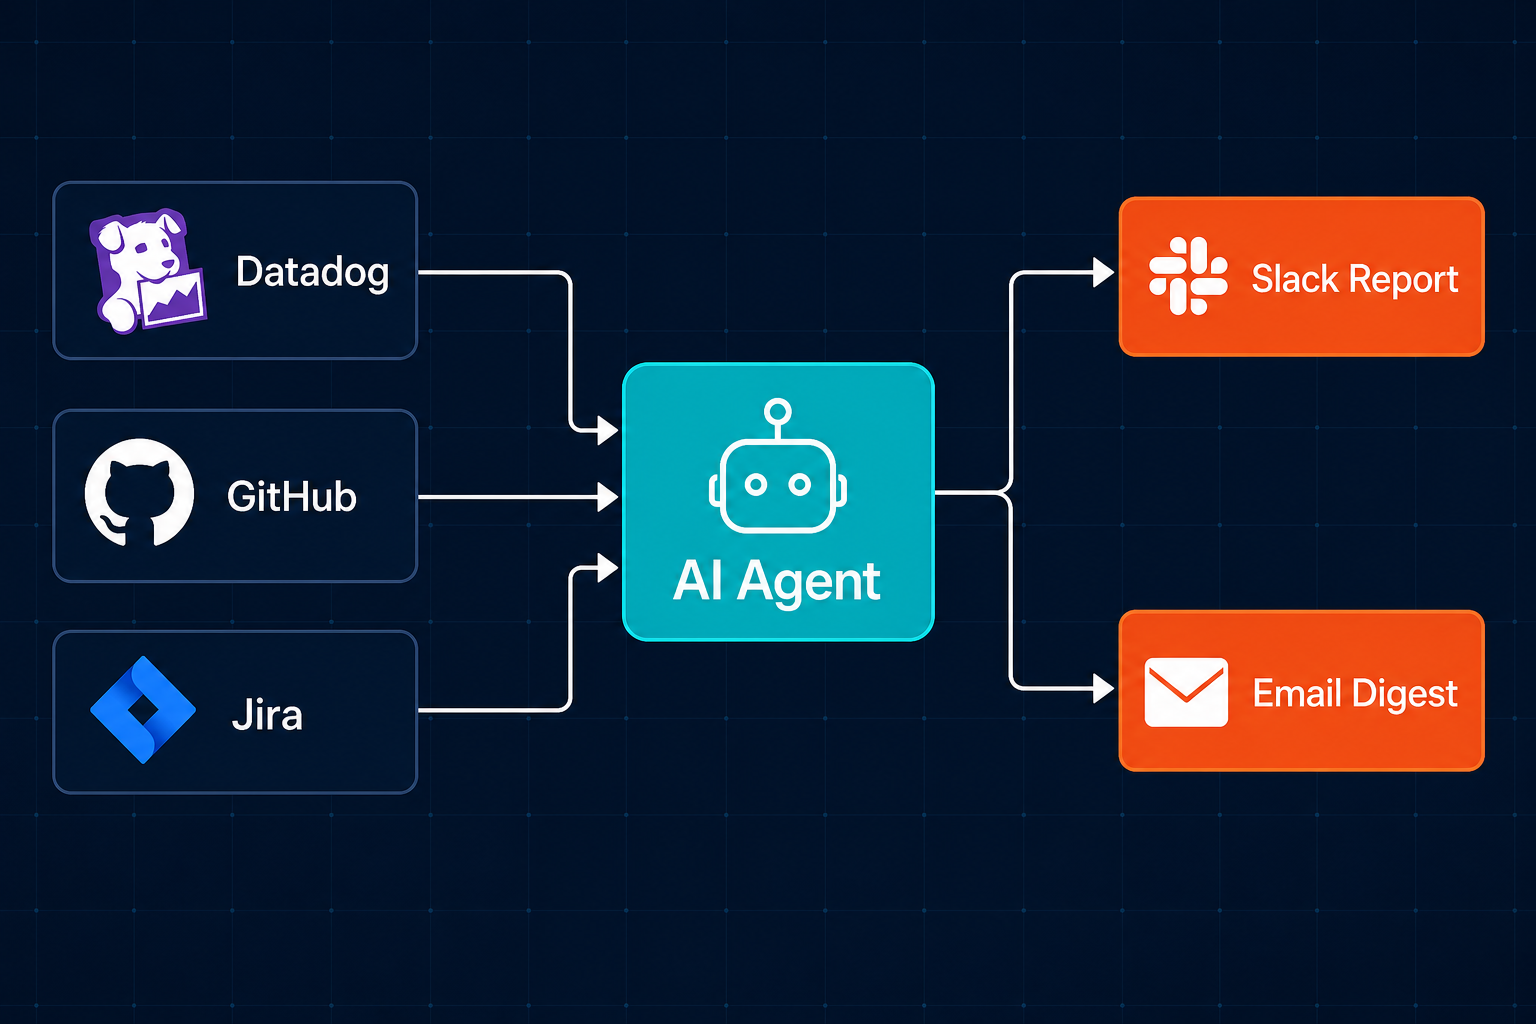
An agent pulls the relevant metrics: SLA status from Datadog, deployment count from GitHub, open issue count and priority breakdown from Jira or Linear. It formats them into a structured report and distributes to Slack and email on schedule. What took hours of manual assembly each week runs in under 5 minutes. The ops lead's Monday morning shifts from building the report to acting on it.
Tool chain: Datadog + GitHub + Jira / Linear → agent → Slack + email What it replaces: Ops lead manually pulls metrics, formats the document, and distributes each week Key metrics: Report turnaround time; stakeholder acknowledge rate
Workflow 6: Postmortem and PIR Drafting
Post-incident reviews have a completion problem. A thorough postmortem requires reconstructing a timeline from multiple systems, often 24–48 hours after the incident when memory has faded and the team has moved to the next problem. Most postmortems end up thin or skipped entirely.
An agent changes the starting point. Within minutes of incident closure, it pulls the Slack incident thread, PagerDuty timeline, relevant GitHub commit history, and associated Jira tickets, and generates a structured draft: timeline, impact assessment, contributing factors, and action item stubs. The engineer's job is to complete and refine it, not reconstruct it from scratch 48 hours later.
Tool chain: Slack + PagerDuty + GitHub → agent → Confluence / Notion draft What it replaces: Engineer writes postmortem from memory 48h later, often incomplete Key metrics: PIR completion rate (% of SEV1/SEV2 incidents with completed postmortems); time from incident close to draft-ready
Workflow 7: SLA/SLO Monitoring and Early Warning
Standard monitoring tells you when you've breached an SLO. That's too late. The useful alert comes when the error budget burn rate indicates you'll breach your window in the next 48 hours, while there's still time to prevent it.
An agent tracks error budget burn rate hourly, calculates projected time to breach at the current rate, and fires an early warning to the responsible team with the specific service, error window, burn trajectory, and recommended action. No confirmed SLO breach should happen without an early warning having already been sent and acted on.
Tool chain: Datadog / Prometheus → agent → Slack + PagerDuty What it replaces: Monitoring alert fires on breach; team reacts after the fact Key metrics: SLO breach rate (target: zero confirmed breaches with compliant early warning in place); early warning lead time
Workflow 8: Capacity Planning Alerts
Capacity incidents are the most avoidable category of ops surprise. Storage runs out. A compute node hits its ceiling. Memory pressure builds on a service that handles traffic spikes. All of these have a measurable trajectory days or weeks ahead of failure.
An agent monitors utilization on a 7-day rolling trend across storage, compute, and memory, calculates time-to-exhaustion at current growth rate, and fires an alert when any resource forecast drops below 30 days, tagging the infrastructure owner with the trajectory and a recommended next step. The surprise capacity incident becomes a scheduled task.
Tool chain: CloudWatch / Datadog → agent → Slack alert + auto-created Jira ticket What it replaces: Infrastructure lead manually reviews resource dashboards on a monthly cycle Key metrics: Unplanned capacity incidents per quarter; forecast-to-actual accuracy
Ops leads spend hours each week assembling status reports. An agent does that in five minutes. That time should go to the problems the report reveals.
Coordination, Escalation, and Compliance (Workflows 9–12)
Coordination overhead in operations comes from two sources: information that lives in one system that someone in another system needs, and requests that require routing through people with inconsistent availability and follow-up habits. These four workflows systematize both.
Workflow 9: Cross-Team Ticket Routing and Escalation
Tickets go stale for two reasons: wrong team, or right team with no trigger to act. An agent fixes both. It monitors Jira or Linear for tickets that have passed their SLA threshold without an assignee update, classifies them by label taxonomy and historical assignment patterns, and escalates with context to the correct team. The escalation message includes current status, related open tickets, time remaining on SLA, and the escalation history.
Tool chain: Jira / Linear → agent → Slack + Jira assignment update What it replaces: Ops lead manually monitors the queue, chases ticket owners, re-routes misrouted items Key metrics: Ticket SLA compliance rate; escalation re-route count (human re-routes after agent routing, target: <5% per week)
Workflow 10: Change Request Processing and Tracking
Change management processes often move at the speed of manual triage. A request arrives, sits unclassified, waits for someone to decide what kind of approval it needs, then waits again for that approval. An agent compresses the first half entirely.
When a change request arrives (via Jira ticket, Slack form, or email) the agent classifies risk level: low risk auto-approved with a full audit log, standard risk routed to the CAB queue, high risk flagged for emergency CAB. The requester gets a status update and expected timeline immediately. The ops manager's attention goes to the high-risk cases; routine requests move without intervention.
Tool chain: Jira + Slack + ITSM (ServiceNow / Freshservice) → agent What it replaces: Operations manager manually triages the change queue; requests stall awaiting classification Key metrics: Change processing time (triage to approval start); CAB queue backlog length
Workflow 11: Vendor and Supplier Follow-Up
Vendor follow-up is one of the easiest workflows to deprioritize under pressure. A ticket is open, a response is overdue, but the ops team is deep in an incident. The follow-up slips.
It tracks every open vendor request (SLA commitments, support tickets, delivery windows) and sends follow-ups on a defined cadence: day 3, day 7, day 14 from the open date. If the vendor is unresponsive after the third touch, the agent escalates to the ops lead with the full communication history attached. Nothing gets lost to incident weeks.
Tool chain: Email + vendor portal → agent → automated follow-up emails + Slack escalation What it replaces: Ops manager manually tracks open requests on spreadsheets and calendar reminders Key metrics: Vendor response rate; average resolution time on open requests
Workflow 12: Compliance Audit Preparation
Compliance audits have a predictable preparation pattern: in the weeks before the audit window, the ops and security team scrambles to aggregate evidence across multiple systems: access logs, change records, incident reports, approval timestamps, policy attestations. Controls that should have been documented throughout the year get reconstructed from memory.
Anthropic's research on building effective agents identifies tasks requiring dynamic decision-making across multiple data sources as the ideal match for agentic systems. Compliance evidence aggregation fits that profile precisely: too bespoke and cross-system for a fixed automation rule, exactly right for an agent with access to multiple source systems.
An agent changes the timeline. Year-round, it aggregates the evidence trail per framework (SOC 2, ISO 27001), pulling from CloudTrail, GitHub, Jira, and IAM systems, flags controls that are missing or expiring, and maintains a living gap summary. Eight weeks before audit, the compliance package is already drafted. The team reviews and closes gaps instead of building the package from scratch.
Tool chain: AWS CloudTrail + GitHub + Jira + IAM system → agent → compliance doc + Slack gap alerts What it replaces: Ops/security team manually assembles evidence 2–4 weeks before audit across 6–10 separate systems Key metrics: Audit prep time (weeks saved); controls gap discovery lead time (pre-agent: 2–3 weeks; agent: continuous)
Agents don't just reduce audit prep time. They make controls visible year-round. The audit becomes a confirmation, not a scramble.
How to Prioritize the Twelve
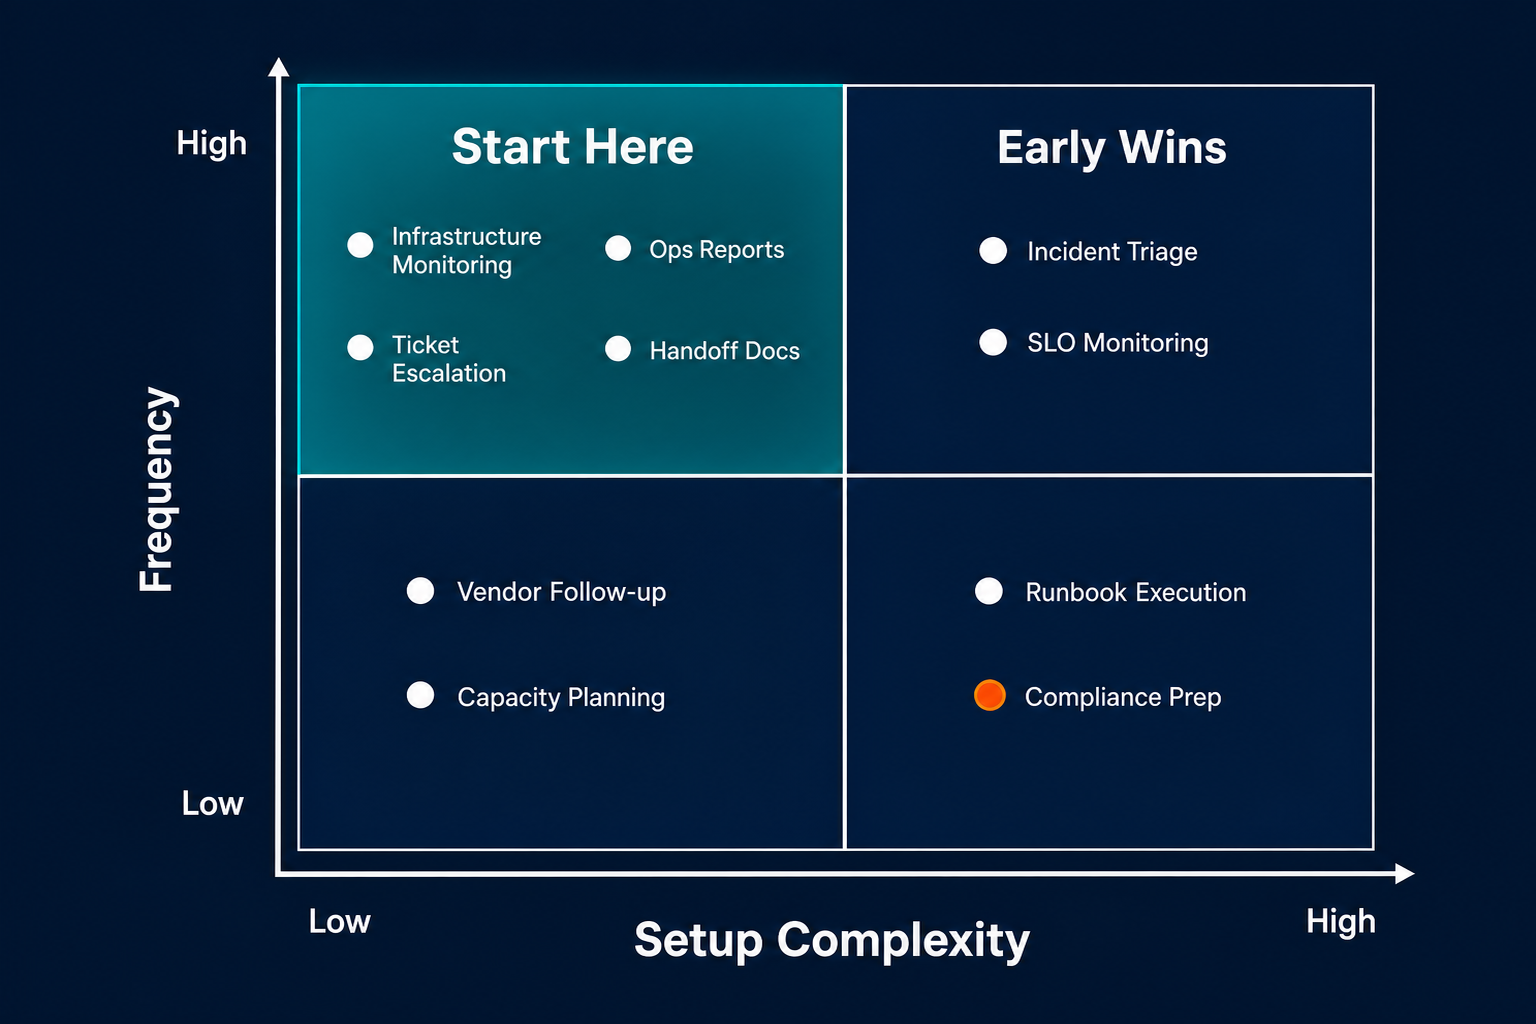
Not all 12 workflows require the same setup effort. Before building, score each on three criteria: frequency (how often does this happen per week?), manual load (how many engineering hours per occurrence?), and blast radius (what slows down or breaks if you skip it?). Start where frequency and manual load are highest, and setup complexity is lowest.
Three clear first movers emerge from that analysis: Workflow 1 (infrastructure monitoring), Workflow 5 (ops status reports), and Workflow 9 (ticket escalation). These are daily occurrences, carry high manual load, and require relatively low setup complexity. Stakeholder visibility is a practical advantage here: improvements in report delivery and incident response time show up within weeks, making the internal case straightforward to build.
Avoid starting with Workflow 12 (compliance audit prep). High data-access requirements, quarterly frequency; critical for the organization, but the wrong place to learn agentic development. Build competence on high-frequency workflows first, then bring that experience to compliance.
One principle that holds across all 12: build one agent per workflow, prove it works reliably, then combine. Multi-workflow mega-agents built before any single workflow is stable are the fastest path to an unreliable system that no one trusts. For the full architecture picture (how individual workflows combine into a coordinated agent platform at scale), see the Enterprise AI Agent Platform: A CTO's Guide to Autonomy at Scale.
| Workflow | Frequency | Setup complexity | Start here? |
|---|---|---|---|
| 1. Infrastructure monitoring | Daily | Low | ✅ First |
| 2. Incident triage | Per incident | Medium | Early |
| 3. On-call handoff docs | Daily | Low | Early |
| 4. Runbook execution | Per incident | High | Later |
| 5. Ops status reports | Daily / weekly | Low | ✅ First |
| 6. Postmortem drafting | Per incident | Medium | Early |
| 7. SLO early warning | Continuous | Medium | Early |
| 8. Capacity planning alerts | Weekly | Low | Early |
| 9. Ticket routing / escalation | Daily | Low | ✅ First |
| 10. Change request processing | Weekly | Medium | Mid |
| 11. Vendor follow-up | Weekly | Low | Mid |
| 12. Compliance audit prep | Quarterly | High | Last |
What to Measure After You Deploy
Six metrics tell you whether the agent is working, not whether the dashboard looks good, but whether the workflow actually changed.
Mean time to detect (MTTD): Baseline in week 1 vs. week 4. A functioning monitoring agent should reduce MTTD by at least 30%. If the number hasn't moved, the alert context or routing isn't landing correctly.
Mean time to remediate (MTTR): Same window. MTTR improvement is the downstream proof that routing lag has been cut. Faster, more accurate triage leads to faster resolution start.
Reporting time reclaimed: Track explicitly. Log how many hours per week the ops lead spent assembling reports before the agent. Measure post-deployment. The delta is the number that matters, not report turnaround time, but engineer time returned to higher-leverage work.
SLA breach rate: Should trend toward zero confirmed breaches after SLO early warning (Workflow 7) is live. If breaches are still happening, the burn rate threshold or alert lead time needs adjustment.
Escalation re-route count: How many tickets per week are humans re-routing after the agent's first routing? Target is under 5% re-routes per week. Above that, the routing model needs retraining on your label taxonomy and historical assignment data.
Compliance gap discovery lead time: Pre-agent baseline is typically 2–3 weeks before audit. Agent target is continuous: gaps surfaced year-round with 8+ weeks of lead time ahead of the audit window.
These six metrics map directly to the 12 workflows. Measure from day one. If a workflow isn't moving its target metric by week four, the configuration needs adjustment, not the underlying approach.
The 12 workflows in this audit aren't theoretical. Pazi builds agents that run these workflows in production: across monitoring, reporting, coordination, and compliance. If you're still running any of them manually, the gap between what you have and what's possible is smaller than it looks.