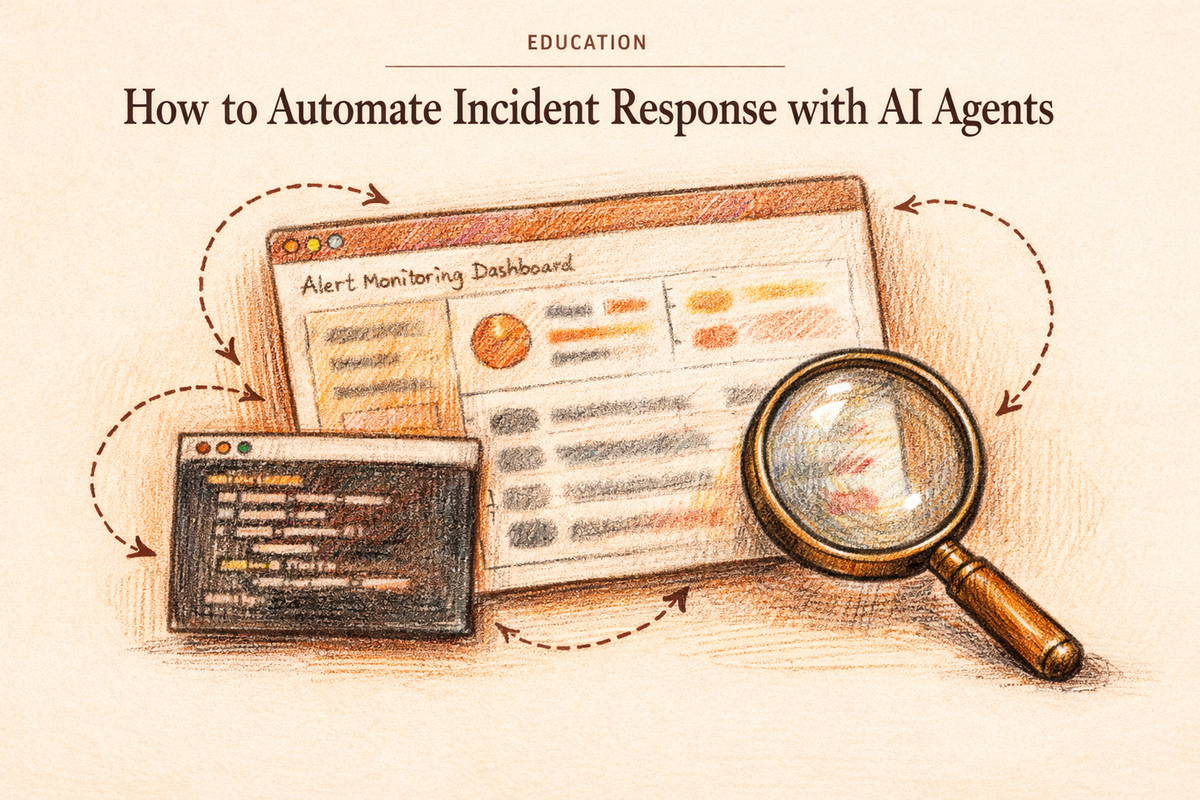
Incident response automation is the practice of handling system failures through predefined software procedures, reducing the decisions that require human intervention. In practice, that means alert rules that trigger runbooks, runbooks that kick off remediation sequences, and escalation paths that page an engineer when the automation cannot proceed.
That system handles the failures you anticipated when you defined the rules. Alerts that match no threshold, faults that cross service boundaries in undocumented ways, and escalations where the runbook has nothing useful to say: those still page a human.
AI agents handle that last category. An AI agent receives an alert, pulls context from recent deploys and log streams, and returns a triage classification before any human is paged. For alerts that need a runbook, the agent matches the pattern, executes the steps, and escalates at decision points with a specific question and the evidence to support it.
This post covers the three structural gaps where rules stall, what AI agents handle at each layer, and how to wire one into your existing incident response loop in four steps.
Table of Contents
- What incident response automation is (and what it isn't)
- Why your current automation still pages you
- What AI agents handle that rule-based systems can't
- How to wire an AI agent into your incident response loop
- What to measure to know it's working
What incident response automation is (and what it isn't)
Incident response automation uses software to handle detection, classification, and initial response steps that would otherwise require manual human action. The most common implementations are rule-based: an alert fires when a metric crosses a threshold, a runbook defines the steps to execute, and an escalation path determines who gets paged and when.
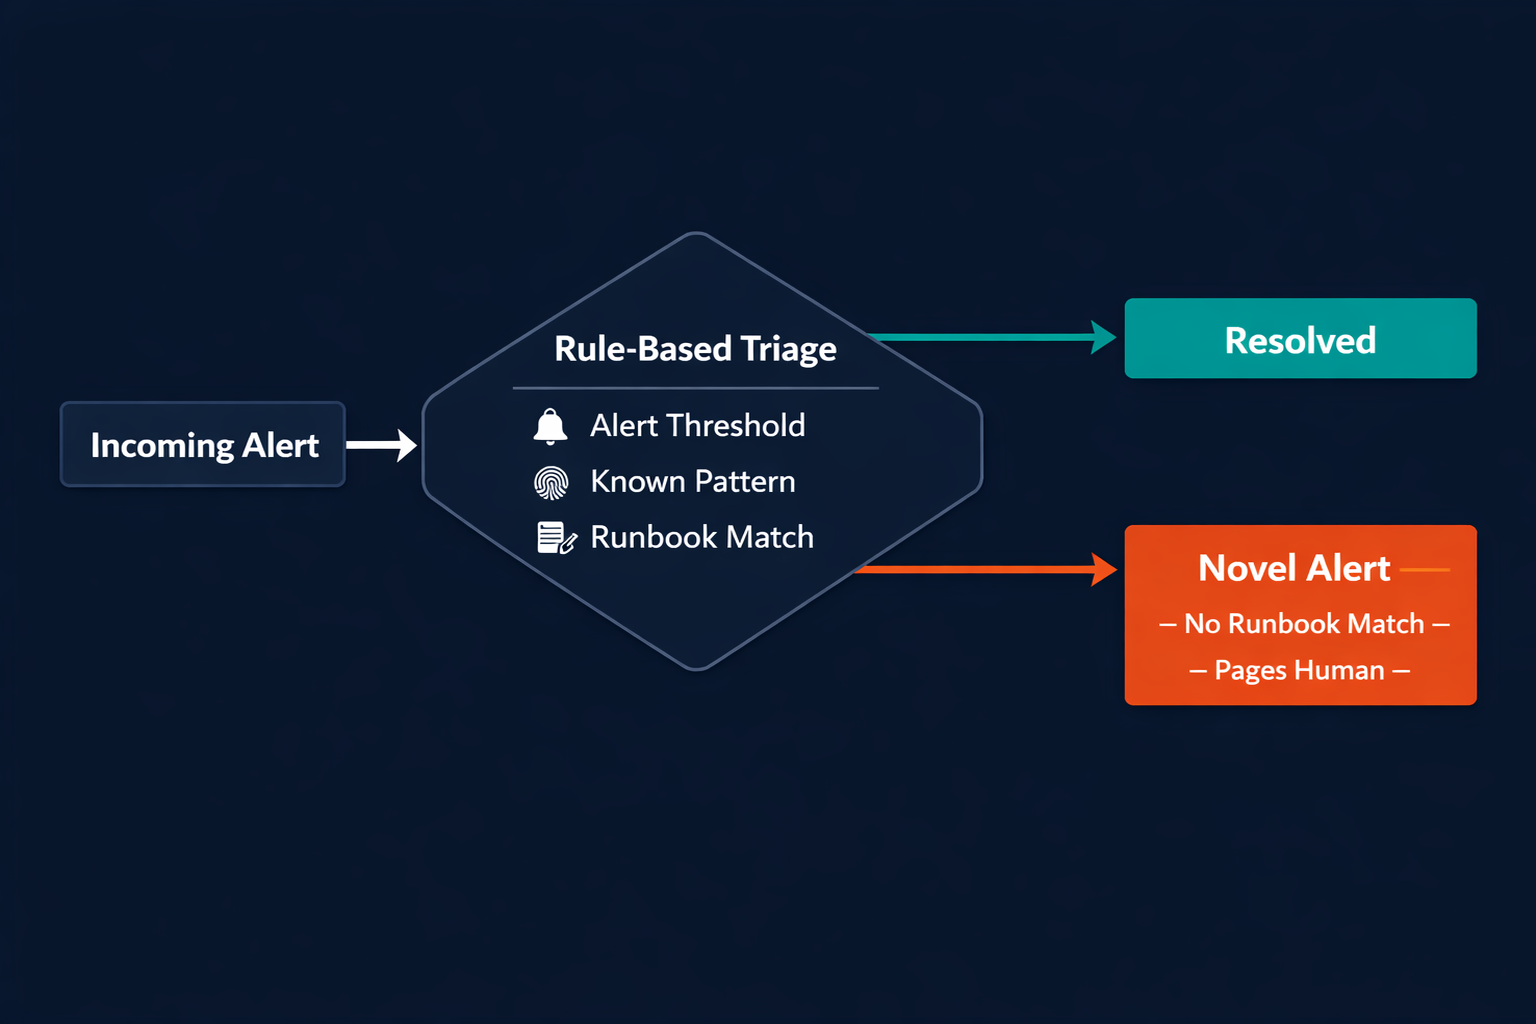
Rule-based automation works well for known failure patterns. If your database CPU exceeds 90% for five minutes, the rule fires, the runbook kicks off a restart sequence, and PagerDuty pages the DBA on call. The automation is deterministic, fast, and reliable for that specific case.
The limit is structural. Rules can only handle what was defined when the rule was written. A novel failure mode produces output that does not match any existing rule cleanly: a cascading fault that starts in a third-party dependency, a memory leak that only manifests under a specific traffic pattern, an alert that looks like noise but is actually a precursor to something bigger. The rule-based system has no response except to drop the alert or page a human.
| Incident step | Rule-based automation | AI agent |
|---|---|---|
| Alert detection | Threshold-based, deterministic | Same threshold detection; agent operates on the output |
| Alert triage | Routes by severity label; no context | Reads alert + deploy history + logs + similar past incidents; classifies accurately |
| Runbook selection | Matches by alert type; fails on novel patterns | Pattern-matches across runbook library; selects closest match; flags gaps |
| Runbook execution | Executes defined steps sequentially | Executes steps; pauses at decision points requiring human judgment; escalates with context |
| Escalation routing | Routes by label and on-call rotation | Routes by service topology and ownership; attaches summary |
| Postmortem | Manual write-up by the resolving engineer | Drafts timeline and root cause hypothesis from incident thread; human reviews |
The distinction matters because it frames what automation can actually do: the rule-based layer handles the execution of known procedures. The AI agent handles the decision-making that precedes and surrounds those procedures.
Why your current automation still pages you
Rule-based automation has three structural gaps that explain most unnecessary pages.
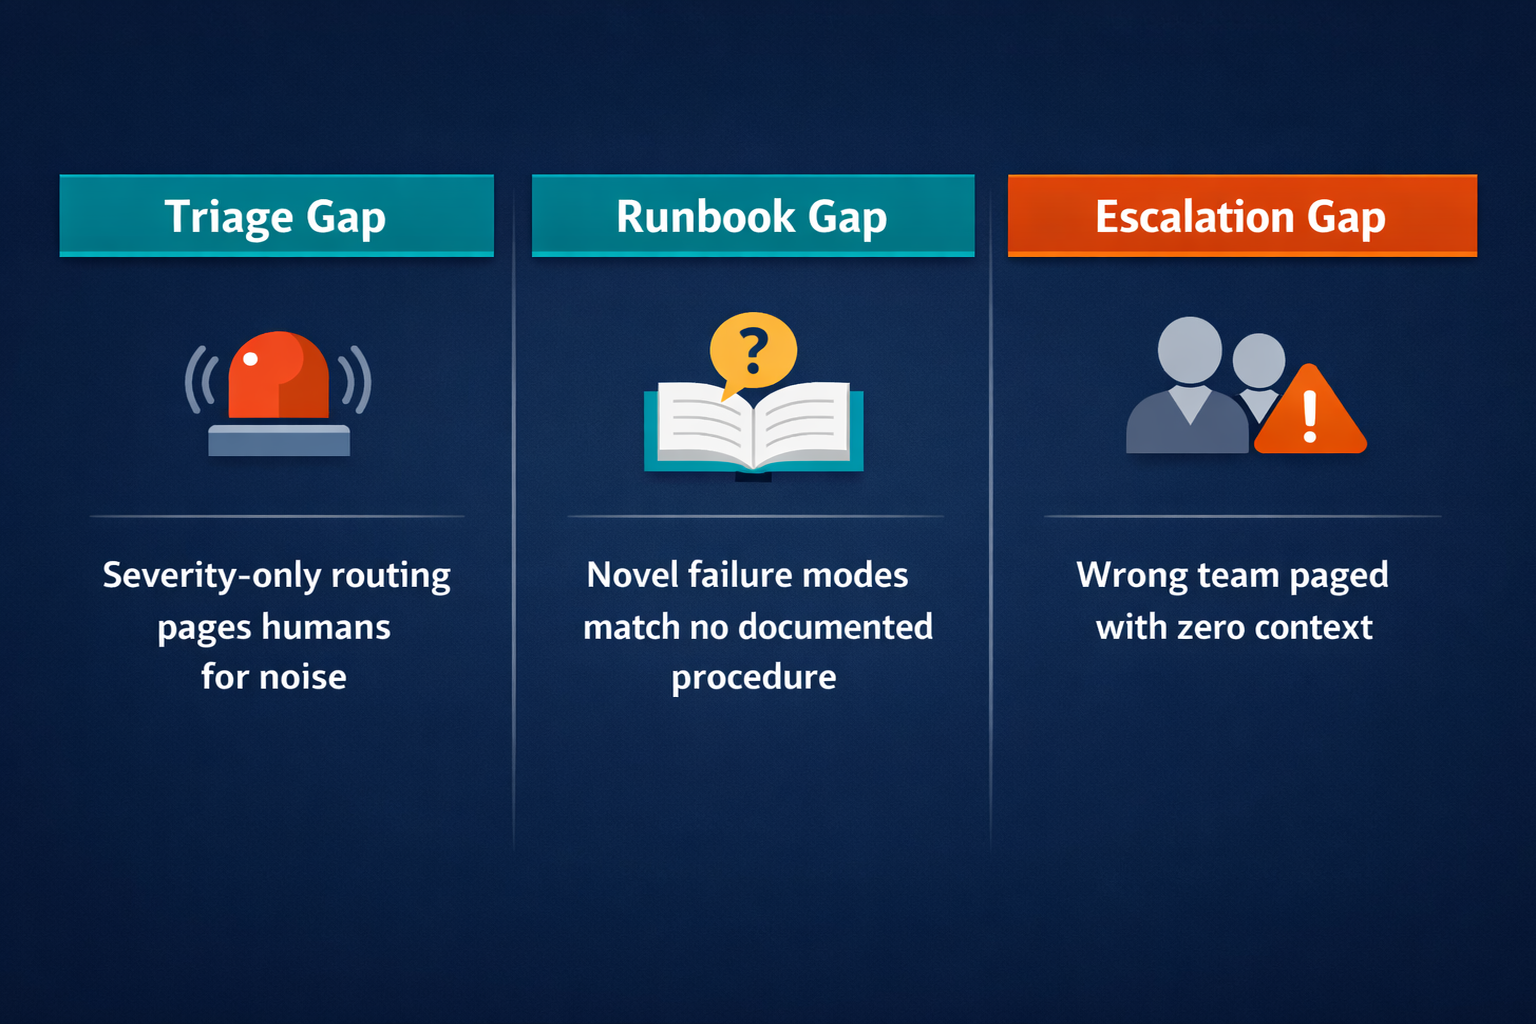
The triage gap. Alert routing based on severity thresholds is coarse. When every alert above P2 pages the on-call engineer by default, the engineer becomes the triage layer. The automation detected the alert; the human decides whether it actually warrants attention. For teams with noisy alert environments, this means a substantial fraction of pages are for events the engineer reads, classifies as low-priority or a known artifact, and closes in under two minutes. The automation did its job; the triage decision still required a human.
The runbook gap. Runbooks encode procedures for known failure modes. They are excellent at what they were written for. The problem is that production failure modes expand over time faster than runbook libraries do. A failure that crosses service boundaries, a new failure mode introduced by a recent deploy, or a combination of conditions that triggers an alert but matches no runbook exactly: these stall the automation. The runbook layer either picks the wrong runbook, picks nothing, or escalates to a human who then has to diagnose the situation from scratch.
The escalation gap. Escalation routing based on alert labels and on-call rotation schedules works at steady state. It breaks when the alert label is wrong, when the incident crosses team boundaries, or when the person paged has no context for the service that is failing. The engineer receives a raw alert with a stack trace and no summary of what was tried or what changed in the last 24 hours. They build context from scratch before they can act.
"Having an incident response team and formal incident response plans enables organizations to reduce the cost of a breach by almost half a million US dollars (USD 473,706) on average." — IBM Think, Incident Response
The IBM finding underscores the asymmetry: the plan is there, the team is in place, and the cost reduction is real. But the plan's execution depends on the automation correctly handling triage, runbook selection, and escalation routing. Those are the three layers where rule-based systems stall. The gap between having the plan and executing it without waking a human at 3 AM is where AI agents operate.
A concrete example of how the gap manifests for a typical SRE team: Sentry fires an alert tied to a spike in 500 errors. PagerDuty evaluates the severity label: P2. The on-call engineer gets paged. The engineer reads the alert, checks the recent deploy log, sees a backend deploy that shipped two hours ago with a known side effect on error counts that self-resolves within an hour, and closes the alert. Time from page to close: four minutes. The rule-based system correctly escalated a P2 alert. It had no mechanism to check the deploy log, recognize the pattern, and suppress the page.
What AI agents handle that rule-based systems can't
AI agents address the three gaps with a different architectural approach: instead of executing a fixed decision tree, they reason over available context before deciding what to do.
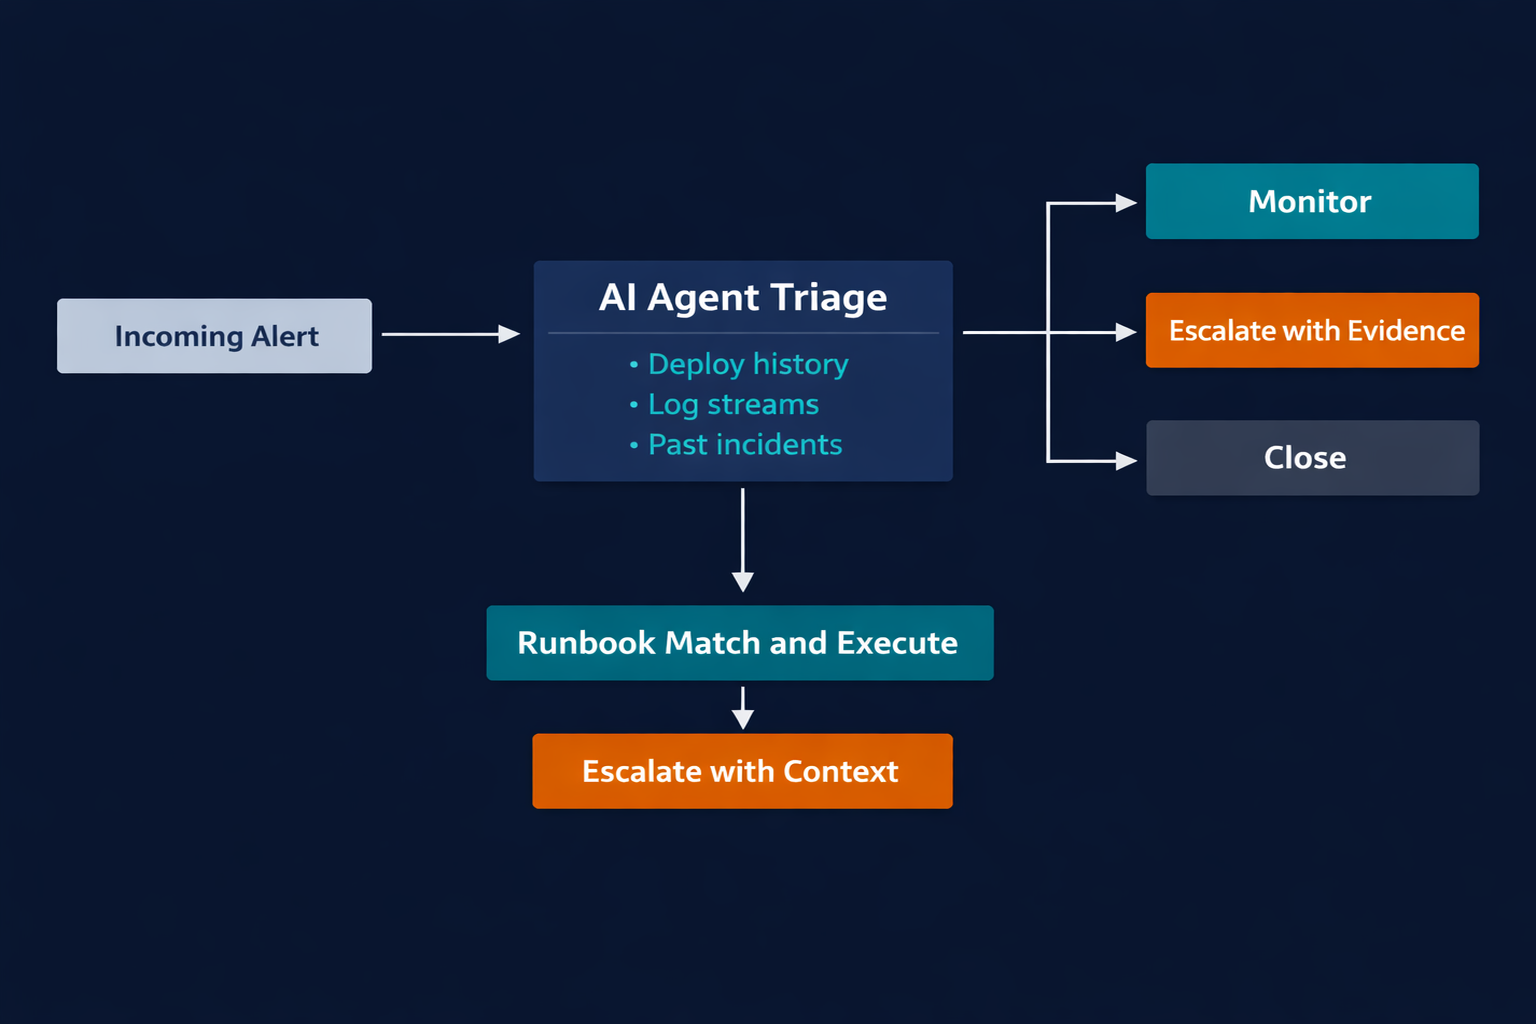
Triage with context. An AI agent receives an alert and immediately pulls available context: the most recent deploys from the past 24-48 hours, related log streams, similar past incidents and their resolutions, and current service health across dependencies. It evaluates whether this alert is consistent with known patterns, known artifacts, or something genuinely novel. The agent returns one of three recommendations: escalate, monitor for a defined window and re-evaluate, or close as a known non-event. This happens before any human is paged, and the reasoning is logged to the incident channel.
Runbook selection and execution. When the agent determines an alert warrants action, it searches the runbook library for the closest match: not a strict label match, but a pattern match based on the failure mode described in the alert and the context gathered during triage. It begins executing the runbook steps, posting progress to Slack in the incident channel. When the agent reaches a step that requires a production action it is not authorized to take unilaterally, or a step where the instructions branch and both paths are plausible, it pauses and escalates with a specific question rather than a raw alert.
Escalation routing with topology awareness. When escalation is necessary, the agent does more than page a name. It maintains a service-to-team map and consults it before routing. It packages the escalation with the context it assembled: the alert summary, what was checked during triage, what the deploy history showed, what runbook step triggered the escalation, and what action the agent needs the human to authorize. The paged engineer receives a briefing, not a raw alert. Context-gathering time drops to near zero.
"Routing classifies an input and directs it to a specialized followup task. This workflow allows for separation of concerns, and building more specialized prompts." — Anthropic, Building Effective Agents
Routing (directing each alert type to the right handler with the right context attached) is the core architectural pattern for the escalation layer. The agent is not replacing the human; it is making the human's first action meaningful instead of diagnostic.
Postmortem drafting. After an incident resolves, the agent assembles a draft postmortem from the incident channel thread. It extracts the timeline of events: when the alert fired, what was checked, what actions were taken, when the issue was resolved. It proposes a root cause hypothesis based on the evidence in the thread and the context it gathered at triage. The draft goes to the resolving engineer for review and annotation, not as a starting-from-scratch exercise.
The comparison with rule-based automation is not about speed, since both approaches execute fast; the distinction is coverage: rule-based automation handles the incidents you designed it for, and the agent handles the incidents you did not.
How to wire an AI agent into your incident response loop
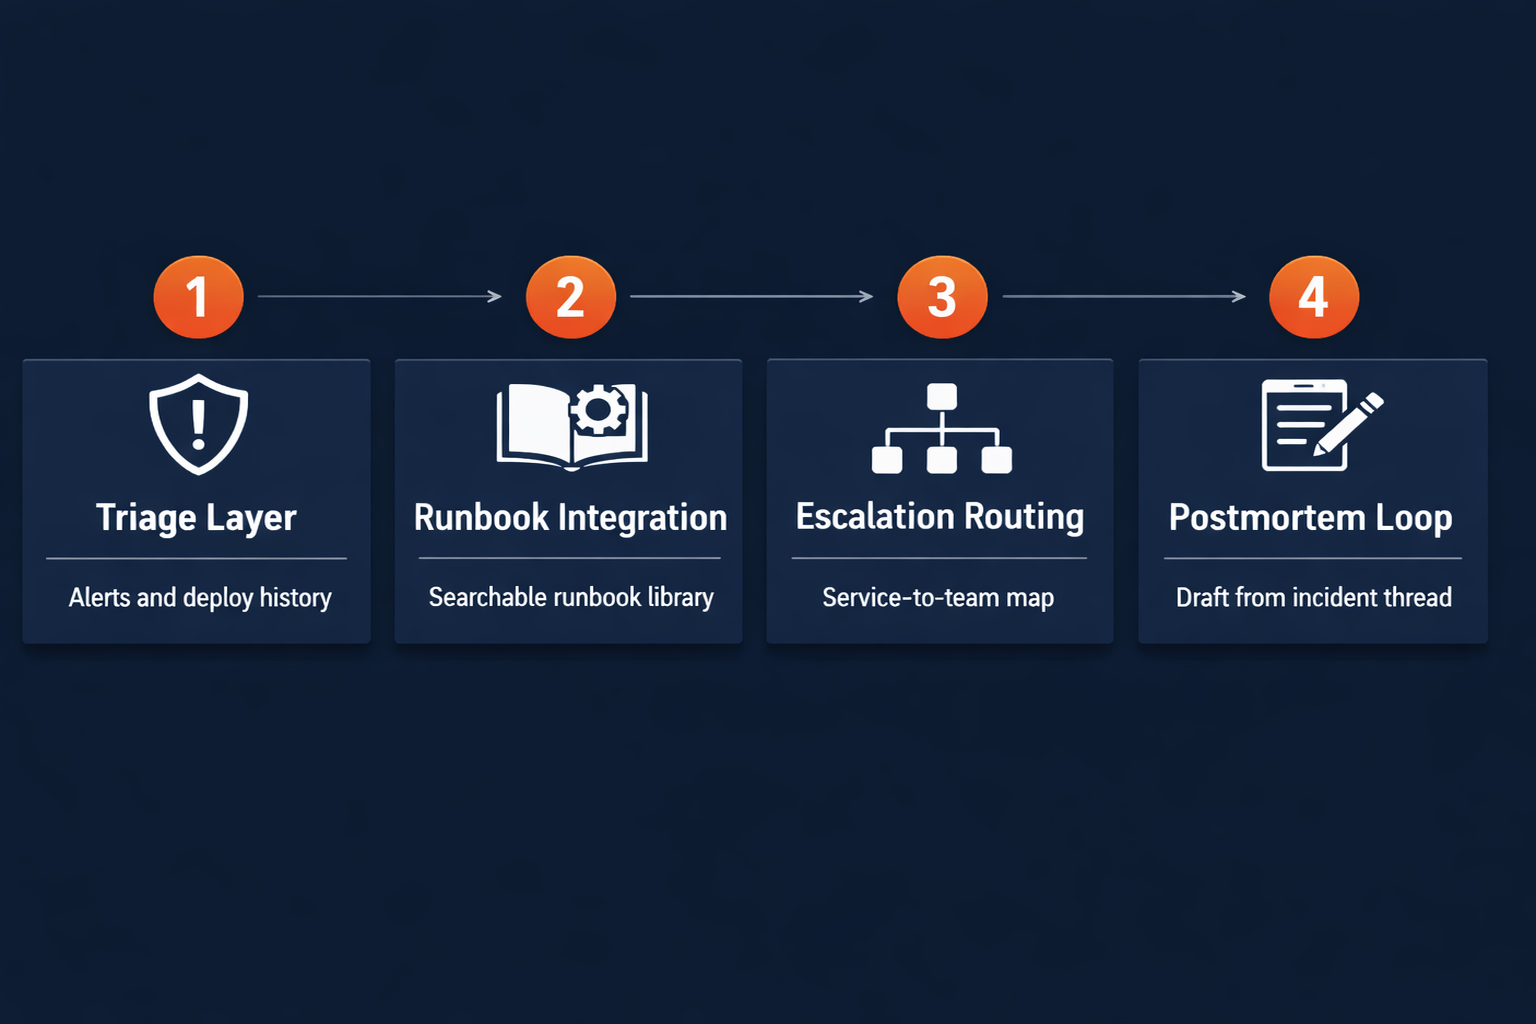
The implementation for an SRE or DevOps team follows four layers. Each layer is independent: you can deploy the triage layer alone and get value without the runbook or postmortem layers.
Prerequisites. You need three things before any of this works: a structured observability stack that produces machine-readable alert output (Datadog, Grafana, Sentry, or equivalent), a runbook library with at least a partial set of documented procedures, and an incident channel in Slack where alerts and response activities are logged. The agent works on the output of your existing stack; you do not need to replace it.
Step 1: Triage layer. Give the agent read access to your alerts and recent deploy history. For most teams this means a Datadog or Sentry webhook posting to the agent's inbox, plus read access to the GitHub or deployment system that tracks what shipped and when. If you're building on Pazi (a platform built to run inside Slack where your team already works), the webhook connection to Datadog or Sentry requires no custom integration layer. Task the agent with one decision on every alert: classify it as escalate, monitor, or close, with evidence for the recommendation posted to Slack. Run this for 30 days before touching the runbook layer. You want to build a baseline of how accurate the triage recommendations are before expanding the agent's scope.
Step 2: Runbook library integration. Once triage accuracy is established, expose the runbook library to the agent as a searchable tool. The agent matches alert patterns to runbooks, begins execution, and escalates at decision points. Start with the three or four runbooks that cover your most frequent incident types. The agent does not need a complete runbook library to be useful; it needs enough coverage to handle a meaningful fraction of the alert volume.
Step 3: Escalation routing. Give the agent a service-to-team map and read access to your on-call rotation in PagerDuty or equivalent. Define the escalation output format: when the agent decides to page a human, it sends a structured context block to the incident channel in Slack before firing the PagerDuty alert. The paged engineer sees the agent's context summary before they reach for the phone.
Step 4: Postmortem loop. After each incident closes, the agent generates a postmortem draft from the incident channel thread and delivers it to the incident channel as a formatted message ready for editing. The resolving engineer reviews, annotates, and publishes the final version. The goal is to eliminate the blank-page problem, not to automate the postmortem entirely.
"AI adoption significantly increases individual productivity, flow, and job satisfaction. However, it also negatively impacts software delivery stability and throughput, reminding teams that fundamentals like small batch sizes and robust testing remain crucial." — DORA 2024, Accelerate State of DevOps Report
The DORA finding applies directly to the scope question. Adding an AI agent to your incident response loop increases the capability of each individual engineer. Deployed carelessly, before triage accuracy has been validated, it can destabilize the system by taking actions on incorrect classifications. Build each layer, validate it, then expand scope. Small batch sizes and careful testing are the right model here, the same as any other infrastructure change.
What not to do in iteration 1: do not give the agent write access to production systems. Do not wire the agent to fire PagerDuty alerts directly without a human-visible confirmation step. Start read-only plus recommend. Expand permissions as the evidence from triage accuracy metrics builds.
What to measure to know it's working
The agent layer is not self-evidently working. You need metrics that distinguish between "the agent ran" and "the agent reduced human burden." Five metrics cover the full picture.
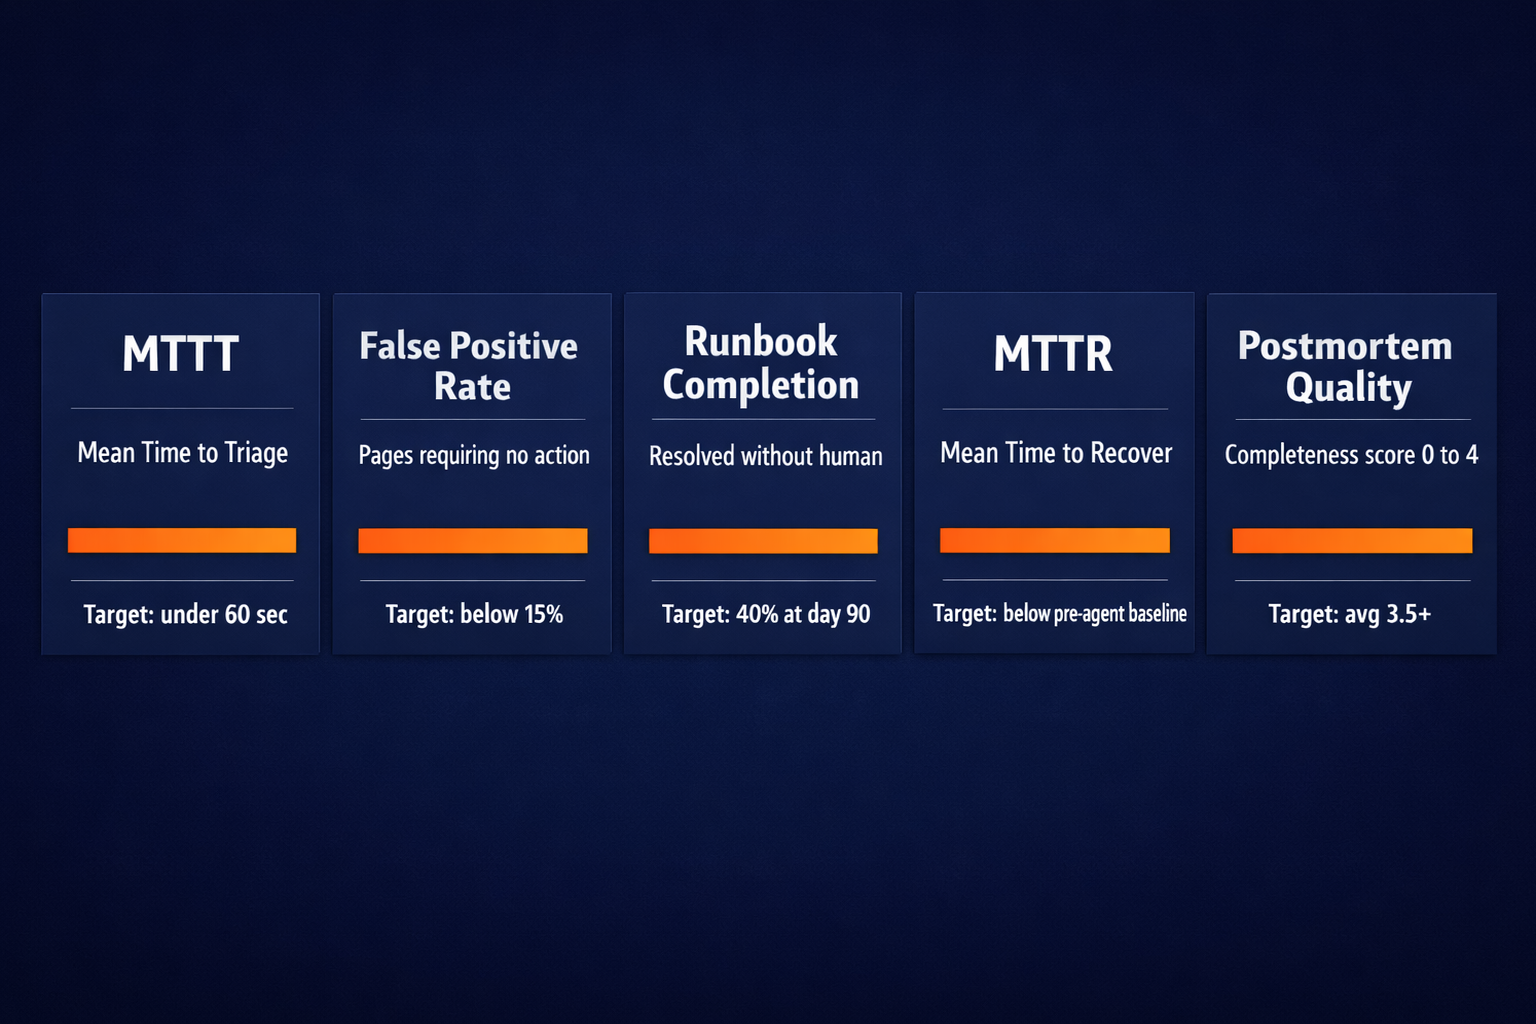
Mean time to triage (MTTT). Time from alert firing to first triage decision. Before the agent, this is the time until an engineer reads the alert and makes a call. After the agent, this is the time until the agent posts its recommendation. For alerts the agent can classify, MTTT should drop to under 60 seconds. Track MTTT separately for agent-handled and human-handled alerts; the delta is your triage automation ROI.
False positive escalation rate. Percentage of escalations (human pages) that turn out to require no action. The engineer reviews, determines the alert is noise, and closes it without intervention. Most teams start at 30–50%. Target: below 15% within 90 days of the triage layer running. If this metric is not moving, the agent's context gathering is incomplete; check what data sources it has access to.
Runbook execution completion rate. Percentage of incidents where the agent completes a runbook from step one to resolution without requiring human authorization of a step. Start low: expect 20–30% in the first month as the agent and runbook library are calibrated. Target: 40% by day 90. A runbook the agent can never complete fully is either missing documented decision branches or covers a class of incident that genuinely requires human judgment at every step. Both are signals to improve the runbook, not the agent.
Mean time to recover (MTTR). The composite metric. MTTR should trend down as the triage and runbook layers absorb more of the resolution work, and as the on-call engineer arrives at escalations with context already assembled. Measure MTTR separately for agent-escalated and non-agent incidents. If agent-escalated incidents have lower MTTR than baseline, the context-packaging step is working.
Postmortem quality score. Structured scoring by the reviewing engineer: does the postmortem include a complete timeline, a root cause hypothesis, contributing factors, and action items? Score each postmortem 0–4 on those dimensions. Track average score by postmortem type: agent-drafted versus manually written. Agent-drafted postmortems should score higher on completeness, particularly for timeline and contributing factors, because the agent assembled that evidence during the incident rather than reconstructing it from memory afterward.
| Metric | What it measures | Baseline method | Target (90 days) | How to track |
|---|---|---|---|---|
| MTTT | Time from alert to triage decision | 30-day pre-agent log | Agent MTTT under 60 sec | Alert timestamp vs. agent response timestamp in Slack |
| False positive escalation rate | % of pages requiring no action | 30-day page log | Below 15% | PagerDuty resolved-without-action count |
| Runbook completion rate | % of incidents agent resolves without human step | Starts at 0 | 40% by day 90 | Incident channel step log |
| MTTR | Time from detection to resolution | 30-day rolling average | Trending down; agent-escalated MTTR below baseline | PagerDuty or incident tracker |
| Postmortem quality score | Completeness score 0–4 | First 10 manual postmortems | Agent drafts average 3.5 or above | Human review score per postmortem |
"Organizations with extensive use of AI in security operations save $1.9M in breach costs compared to organizations that didn't use these solutions." — IBM Cost of a Data Breach Report 2025
The IBM figure is from a security context, but the operational logic holds across SRE and DevOps incident response: the cost reduction from faster identification and containment is real. It is only real if you measure for it. MTTR and false positive rate are the two metrics that most directly translate to engineer time saved and system stability.
Pazi is a platform for building AI agents that run inside Slack, where your team already responds to incidents. For incident response, that means a triage and runbook agent that connects to your observability stack, reads alert context from your monitoring tools, and posts its classification to your incident channel before anyone gets paged. Start with the triage layer and let MTTT tell you whether to expand.
Related reading: