Enterprise AI Agent Platform: A CTO's Guide to Autonomy at Scale
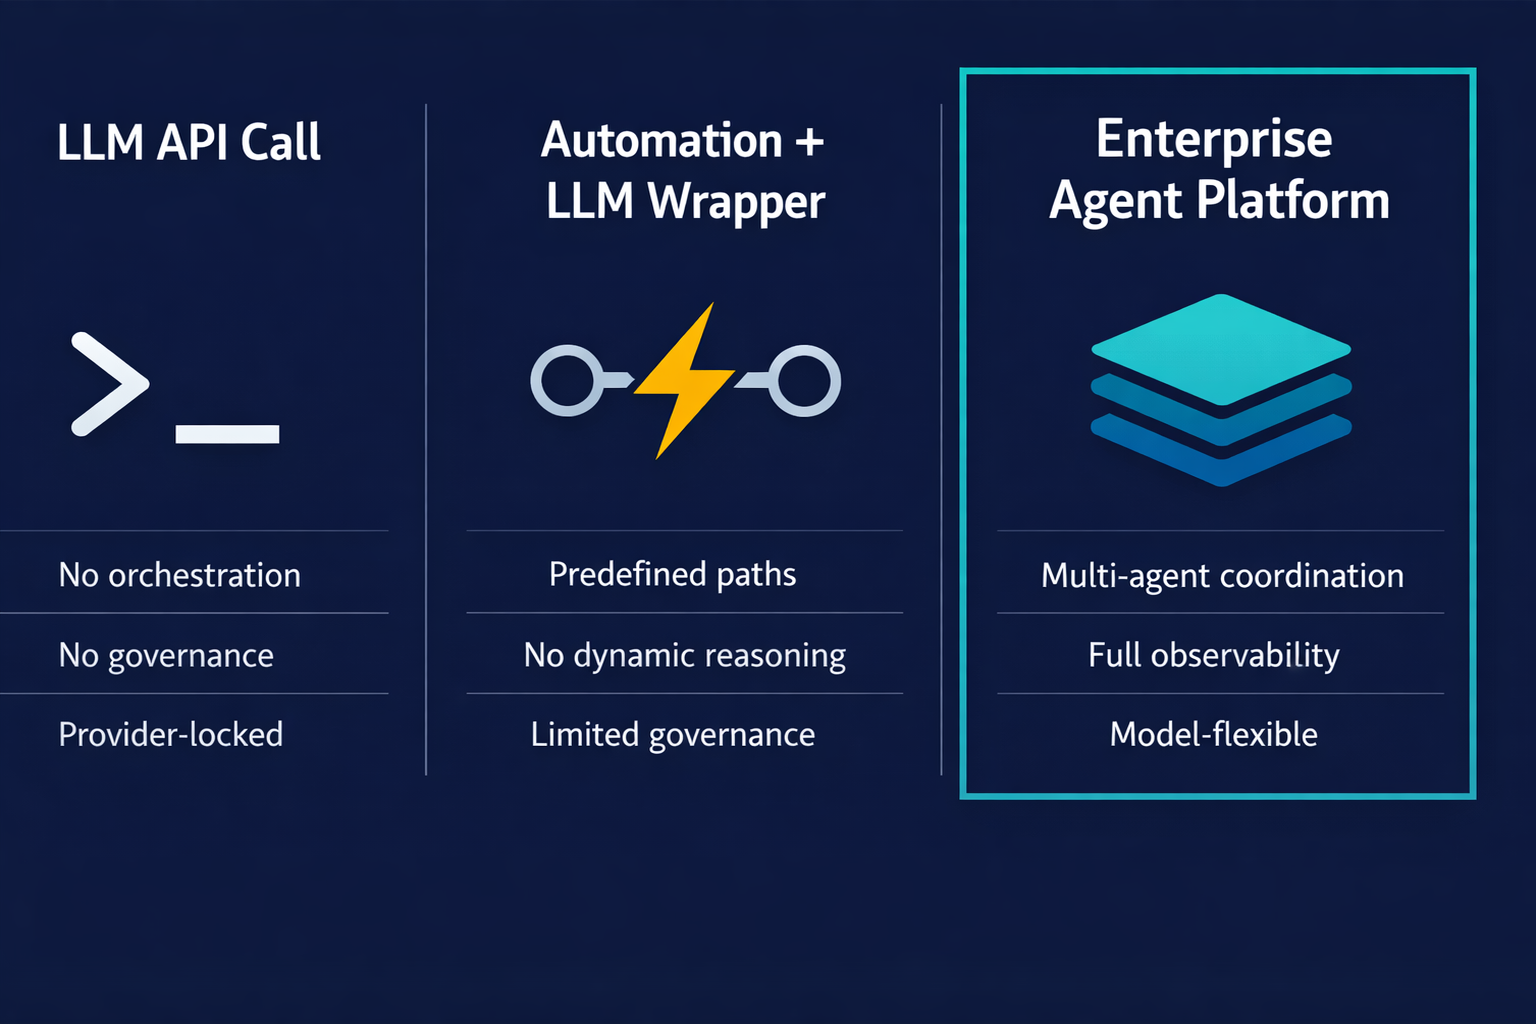
Most CTOs evaluating an enterprise AI agent platform are being pitched two categories of product that don't deliver what the category name implies. The first is a raw LLM API with a tool-calling layer: capable of answering questions and taking individual actions, but without orchestration, governance, or observability infrastructure. The second is an automation tool with an LLM wrapper: reliable on scripted workflows, blocked the moment a task requires judgment rather than rules.
A genuine enterprise AI agent platform is a third thing entirely. It combines multi-agent orchestration with the governance surface that enterprise operations require: role-based access control, audit logs, human checkpoint configuration, model flexibility, and observability that surfaces failures before they become incidents. This guide covers what that architecture looks like, how to evaluate it, and how to roll it out without accumulating technical and operational debt on the way.
Table of Contents
- What an enterprise AI agent platform actually is
- Why the current stack breaks at scale
- Platform architecture: the five layers a CTO needs to govern
- How enterprise teams use agent platforms
- The CTO evaluation checklist
- Three phases of enterprise rollout
- What success looks like: metrics that matter
What an enterprise AI agent platform actually is
The term "enterprise AI agent platform" is being applied to products across a wide capability spectrum. Some are single-agent tools with a governance marketing layer. Others are genuine platforms: infrastructure that supports multiple agents, multi-step workflows, and organizational controls at scale. Understanding the distinction matters before any evaluation conversation begins.
An enterprise agentic AI platform is defined by what it governs, not just what it runs. Running LLM-powered tasks is a low bar. Governing them, with full traceability, access controls, configurable oversight, and failure detection, is the enterprise requirement.
The agent vs. automation distinction
The foundational distinction is between systems that follow predefined code paths and systems that determine their own path. Anthropic's engineering team put it directly in their guide to building effective agents: "Workflows are systems where LLMs and tools are orchestrated through predefined code paths. Agents, on the other hand, are systems where LLMs dynamically direct their own processes and tool usage, maintaining control over how they accomplish tasks."
"Agents are systems where LLMs dynamically direct their own processes and tool usage, maintaining control over how they accomplish tasks."
Anthropic, Building Effective Agents
For the CTO evaluating how AI agents differ from automation tools, this distinction carries governance implications. Automation tools can be audited against their scripts. What the script permits is what the system does. Agents determine their actions dynamically. That flexibility requires a governance layer that automation tools don't need and often don't have.
What "enterprise" adds to the equation
Enterprise-grade agents differ from consumer or developer-grade agents in five areas.
Security controls: SSO/SAML authentication, role-based access control at the agent and tool level, PII masking, and data residency controls. An agent that can call Slack, GitHub, Jira, and your CRM requires the same access governance as any other privileged service in your stack.
Integration architecture: An enterprise AI agent platform meets the stack where it already lives: Slack, GitHub, Linear, Sentry, Jira, PostHog, Intercom, and the rest of the existing toolchain. Native connections, not a middleware translation layer. Integration depth determines which workflows agents can own in practice, not just in demos.
Model flexibility: Enterprise workloads span a range of cost, latency, and capability requirements. A platform locked to a single LLM provider creates vendor dependency that compounds over time. The architecture should support multi-model deployment: different models for different workflow types, with the ability to swap providers as the market evolves.
Deployment model: Cloud-hosted, on-prem, or hybrid, with the data residency and network isolation controls that compliance teams require. The evaluation question is not whether the vendor offers each deployment option; it is whether the controls are native or require custom configuration to maintain.
Observability: Full trace of every agent run: what the agent did, in what order, with what tool calls, and with what outcome. Alerting on silent failures, budget overruns, and tool call failure rates. This is the control surface that makes agents governable at scale.
Why the current stack breaks at scale
Enterprise teams arriving at this evaluation have usually tried one of three approaches first: raw LLM API calls, automation tools with an LLM wrapper, or point-agent tools without a governance layer. All three fail the same way when the workload grows.
"Unlike traditional AI models, which operate within predefined constraints and require human intervention, agentic AI exhibits autonomy, goal-driven behavior and adaptability."
IBM Think, Agentic AI
IBM's framing surfaces the core problem: the attributes that make agentic systems capable, autonomy, adaptability, goal-driven behavior, are also the attributes that require infrastructure to govern. Without that infrastructure, each additional agent deployed increases the governance debt rather than reducing the operational load.
The predefined-path ceiling
Automation tools execute predefined sequences reliably. That reliability is also their ceiling. When a workflow step requires judgment, a routing decision, an ambiguous input, a situation the script didn't anticipate, automation tools stop. The work that falls outside the script falls back to humans, and the volume of that work grows as the business grows.
LLM API calls without orchestration fail differently. They can handle individual steps that require judgment, but they cannot coordinate multi-step, multi-agent work reliably. Each call is stateless. There is no memory of prior steps, no tool permission model, no retry logic, no failure surfacing. Anthropic notes that agentic systems "often trade latency and cost for better task performance." The implication: without platform infrastructure, you carry the cost and latency without the performance guarantee.
The four enterprise-specific failure modes
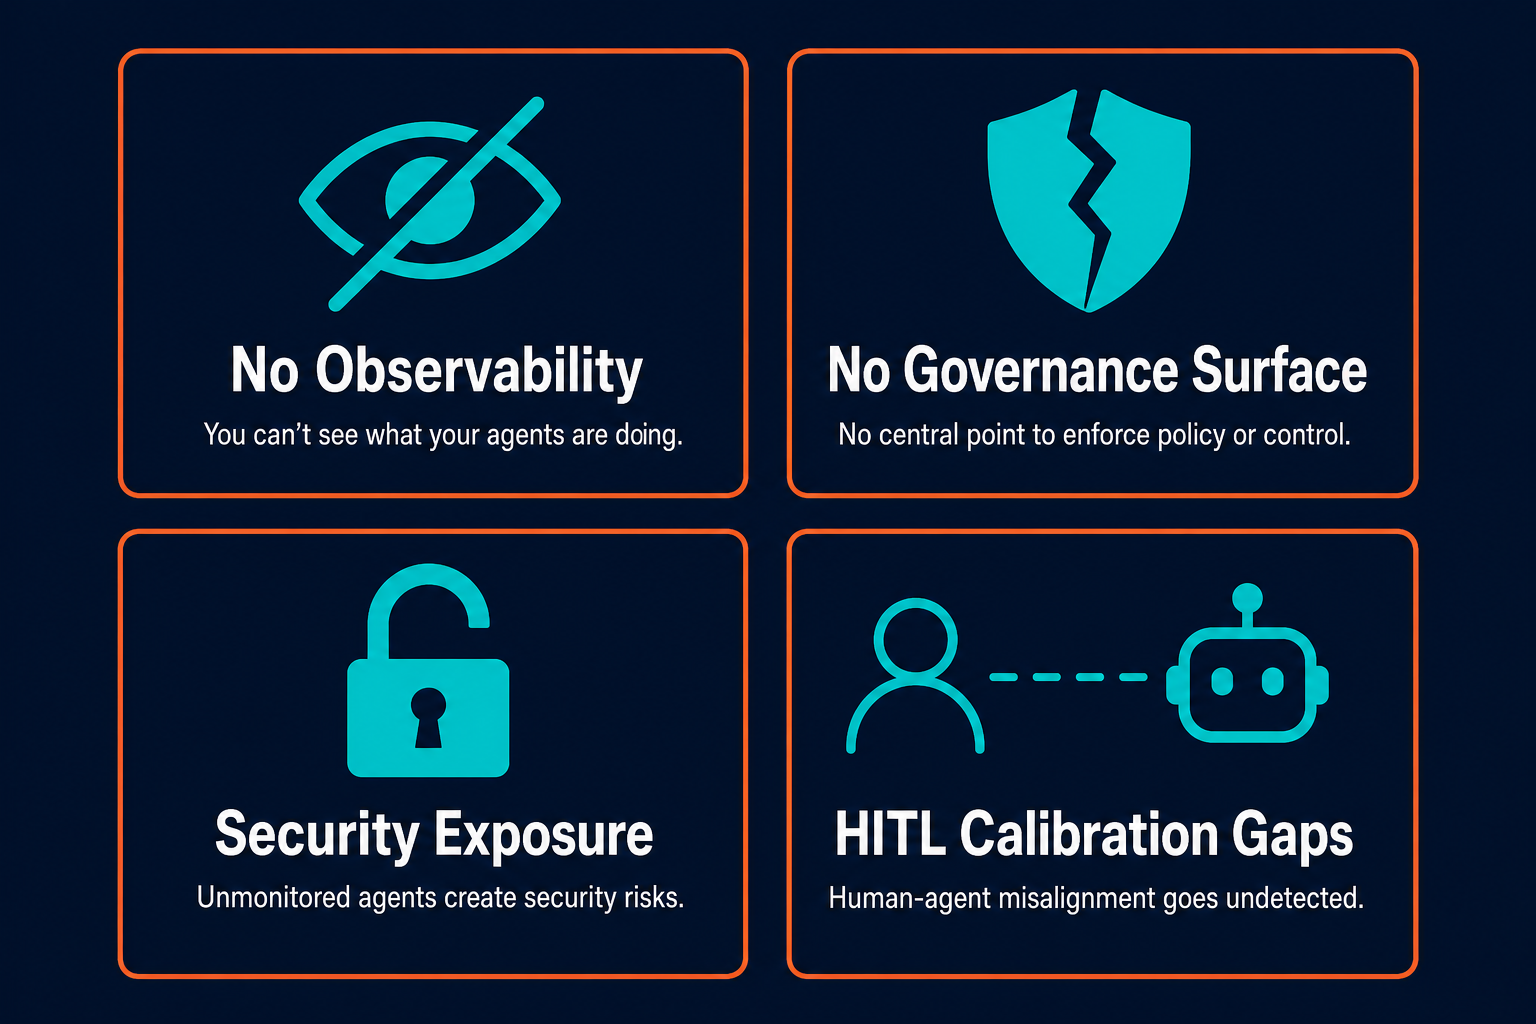
No observability. Agents report success while work silently fails. A cron-scheduled agent that creates a GitHub issue and updates a Jira ticket, then runs out of budget before posting to Slack, reports the run as complete. The platform says green; the team sees nothing. The silent failure modes in production agents are not edge cases. They are structural, and they are invisible without the right instrumentation.
No governance surface. Without an audit trail, there is no way to answer the questions that compliance and security teams will ask: What did the agent do? Who authorized it? What data did it access? What happened when it failed? Without run replay and structured logging, the answers require manual reconstruction or are unavailable entirely.
Security surface area. An agent with tool access and no per-tool permission model has access to everything the API keys permit. RBAC at the agent level, defining exactly which tools each agent can call, is the mechanism that limits blast radius when an agent misbehaves or is compromised.
Human checkpoint gaps. Both failure directions are real. Over-gating kills throughput: the agent saves no time if every action requires human approval. Under-gating accumulates silent errors: the agent handles routine cases well and then fails on edge cases with high confidence. Calibrated human-in-the-loop checkpoints, configurable per workflow based on risk profile, are the mechanism that prevents both failure modes.
| Capability | LLM API calls | Automation + LLM wrapper | Enterprise agent platform |
|---|---|---|---|
| Multi-agent orchestration | None | Limited | Native |
| Observability and tracing | None | Basic logs | Full trace and alerts |
| RBAC and audit logs | None | None | Native |
| Human checkpoints | Manual only | Manual only | Configurable per workflow |
| Model flexibility | Provider-locked | Provider-locked | Multi-model |
| Integration depth | API only | Fixed connectors | Channel-native and API |
Platform architecture: the five layers a CTO needs to govern
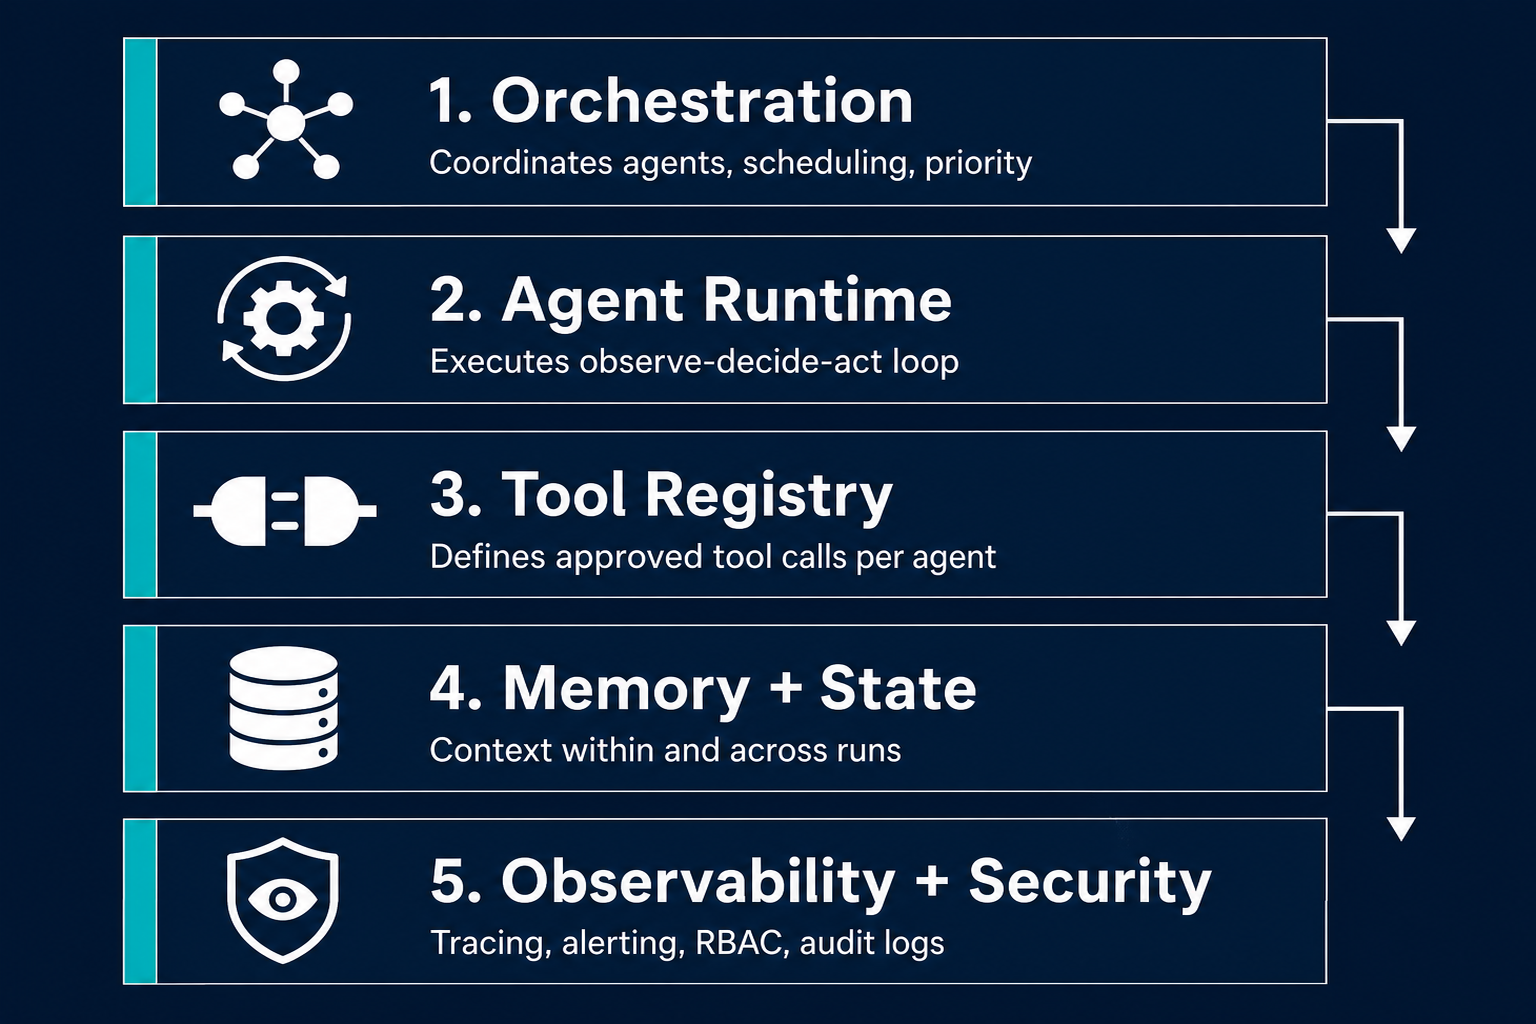
A platform that supports enterprise agentic AI workloads requires five distinct infrastructure layers. Each layer has a clear function, and each has a clear failure mode when absent. The evaluation checklist in the next section maps to these layers: for each layer, there is a question to ask any vendor.
Orchestration layer
The orchestration layer routes work between agents, manages multi-agent coordination, and handles scheduling: cron-based, event-triggered, and on-demand. Without orchestration, each agent operates independently. There is no priority management, no coordination across concurrent agents, no mechanism to sequence multi-step workflows that span multiple agents and tools.
This is where multi-agent architectures break without a platform. Individual agents may function correctly in isolation, but without an orchestration layer that understands their interdependencies, the system cannot manage concurrent runs, handle upstream failures without propagating them downstream, or prioritize work across competing demands.
Agent runtime
The agent runtime is where agent logic executes: the observe-decide-act loop that agents run to complete tasks. It handles context management within a run, budget tracking to prevent runaway spend, tool call sequencing, and error surfacing. Without a runtime, raw LLM calls have no state between steps, no retry logic when a tool call fails, and no mechanism to propagate errors in a way the orchestration layer can respond to.
The runtime also distinguishes between a failed run and a silent run. A run that errored visibly is recoverable. A run that completed its internal steps without delivering the intended output is invisible without runtime-level instrumentation.
Tool registry
The tool registry is a catalog of approved tools that agents are permitted to call, with per-agent permissions defined explicitly. Slack is available to Agent A but not Agent B. GitHub write access is available only to the deployment agent. PostHog queries are read-only for the analytics agent.
Without a tool registry, every agent has access to every API key it can construct a call for. The security surface area is unbounded. Every tool call needs to be logged against a permission that was explicitly granted, which is the answer to "what did the agent have access to" when a compliance review asks.
Memory and state management
Memory and state management covers two scopes: short-term context within a single run, and long-term memory that persists across runs. Short-term context enables agents to maintain coherence through multi-step tasks. Long-term memory enables agents to learn from prior runs, recognize patterns, avoid repeated mistakes, and maintain continuity across sessions.
Without memory infrastructure, every run starts cold. An incident-response agent that handled the same failure pattern three times last week starts from scratch on the fourth encounter. A deployment-watch agent that has learned normal deploy time variance cannot distinguish a slow deploy from a broken one.
Observability and security
Observability at the platform level covers three capabilities: tracing (a complete record of every step in every run), alerting (failure events, silent drops, budget overruns, and tool call failure rates surfaced proactively), and audit logging (a structured record tied to access controls and run authorizations).
Security controls at this layer include SSO/SAML for team authentication, RBAC for defining what each agent and each human operator can access, PII masking to prevent sensitive data from appearing in logs, and data residency controls for regulated industries. The silent failure modes in production agents are only detectable through this layer: specifically, the distinction between a run that completed its steps and a run that delivered the intended output.
| Layer | Function | What breaks without it |
|---|---|---|
| Orchestration | Coordinates multi-agent workflows; scheduling and priority | Agents run in isolation; no coordination; no system-level budget control |
| Agent runtime | Executes the observe-decide-act loop; manages context and budget | No state persistence; errors surface late or not at all |
| Tool registry | Defines approved tool calls per agent | Uncontrolled API access; security and compliance exposure |
| Memory and state | Maintains context within and across runs | Every run starts cold; no learning or continuity |
| Observability and security | Traces runs; enforces access controls; surfaces failures | Silent failures; no audit trail; governance gaps |
How enterprise teams use agent platforms
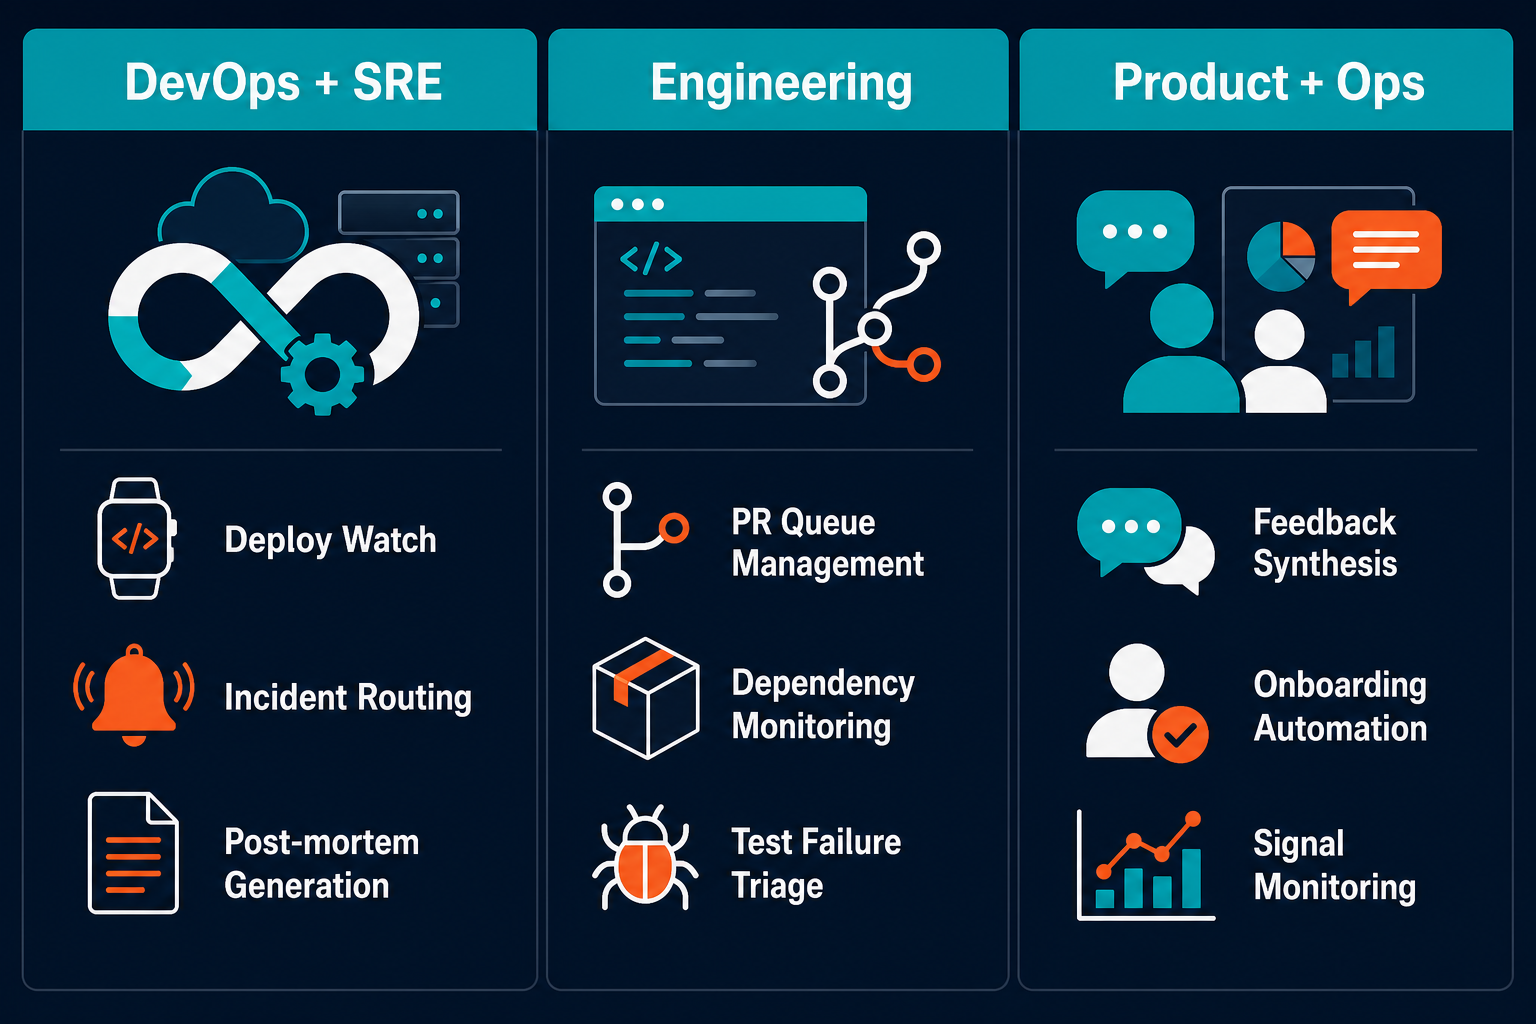
The use cases that generate the most consistent return in B2B SaaS organizations are concentrated in three team types: DevOps and SRE, engineering, and product and ops. In each case, the agent layer owns high-frequency, judgment-dependent workflows that were previously handled by humans. Not because humans were the right tool for the job, but because no alternative could handle the judgment requirement at the required frequency.
DevOps and SRE
Deployment watch. An agent monitors GitHub Actions or CircleCI, posts deploy status to Slack, and pages the SRE on-call when a Sentry error spike crosses a configured threshold. The agent applies judgment: distinguishing a known post-deploy error pattern from a novel failure, rather than routing every alert to a human.
Incident response. On a PagerDuty or Sentry alert, the agent routes to the on-call engineer, pulls relevant context from Linear for the affected service, and drafts an initial incident thread with timeline and context attached. The SRE receives a structured starting point rather than a raw alert with no context.
Post-mortem generation. After an incident closes, the agent assembles the timeline from Sentry error logs, GitHub commit history, and Slack threads, and drafts a post-mortem document in Notion or Confluence. The draft goes to the incident lead for review rather than starting from a blank page.
Engineering teams
PR review queue management. The agent monitors GitHub for pull requests that have been open without review past the team's configured threshold, typically 24 to 48 hours, routes them to the assigned reviewer with a Slack notification, and includes a summary of the change. Stale PRs stop falling through the queue.
Dependency monitoring. The agent checks npm or pip packages against CVE databases, creates Jira tickets for flagged vulnerabilities, and prioritizes by CVSS score. High-severity CVEs route to the security lead immediately. Lower-severity items appear in the weekly engineering review queue. No human monitors the CVE feed manually.
Test failure triage. When a test suite fails on a commit, the agent routes the failure to the committing engineer in Slack with Sentry error context attached and a link to the specific failing test. The engineer receives the information needed to start debugging rather than raw test runner output to interpret.
Product and ops
User feedback synthesis. The agent ingests support tickets from Intercom or Zendesk, tags them by theme and feature area, and surfaces a weekly synthesis to the Product team in Slack. Product reads a structured summary of emerging themes with representative examples, not every individual ticket.
Onboarding automation. New hires receive an automated Slack onboarding sequence: welcome messages with role-specific context, scheduled 1:1 invites with their manager and immediate team, and tool provisioning requests routed to the appropriate owners. The ops team designs the sequence once; the agent runs it for every new hire.
Signal monitoring. The agent watches Intercom and PostHog event streams for signals: activation drops, feature adoption spikes, error rate changes tied to specific product areas. It surfaces anomalies and usage inflections to the Product team in Slack as they occur, tagged by feature area and severity. Product receives the signal at the moment it appears, not in a weekly report.
Pazi is the enterprise agent platform built for the workflows above. It runs on the OpenClaw runtime and ships with native integrations across 22+ channels including Slack, GitHub, Jira, Sentry, Linear, Intercom, and Microsoft Teams, plus 16 more. RBAC, audit logging, and observability are built into the platform, not added through a third-party integration. Teams use Pazi to run incident routing, PR monitoring, feedback synthesis, and deployment watch without building or maintaining a custom orchestration layer.
The CTO evaluation checklist
With the architecture framework established, the evaluation conversation becomes more specific. The questions below map directly to the five platform layers described above. A vendor that cannot answer them specifically, or deflects to roadmap language, has answered the question in a different way.
Seven questions to ask any vendor
1. What is the observability model? Can you trace every run, see every tool call and its outcome, and receive proactive alerts on failures, including silent ones where the run completed its logic but did not deliver the intended output?
2. What does the access control model look like? Is RBAC native to the platform, or is it a permissions layer added after the fact? Is SSO/SAML available on the plan being sold, or is it enterprise-tier only?
3. What is the model flexibility story? Are agents locked to a single LLM provider at the platform level? Can you swap models per workflow type? What happens to your agents if the vendor changes their model pricing or access policies?
4. How do human checkpoints work? Can you configure per-workflow checkpoint gates, defining which actions require human approval before proceeding? Can you audit what the agent did at each gate, and replay a run to verify the decision path?
5. What is the deployment model? Cloud-hosted, on-prem, or hybrid? What data residency controls are available? What network isolation options exist for regulated data?
6. What is the integration architecture? Does the platform connect natively to the tools your teams already use, or does it require a middleware translation layer? What is the full integration list, and which integrations are native versus webhook-based?
7. What does failure look like from the platform's perspective? When an agent fails silently, completing its steps but not delivering the output, how does the platform surface it? What is the recovery path, and who is notified?
Build vs. buy: the decision framework
For most B2B SaaS CTOs, building the orchestration, observability, and governance layers described above is equivalent to shipping a second internal product. The build decision is defensible when the workload has requirements that no available platform meets, or when the organization has the platform engineering capacity to build and maintain it indefinitely. In most cases, neither condition applies.
Build vs. buy is not a question of technical capability. It is a question of where platform engineering time should go.
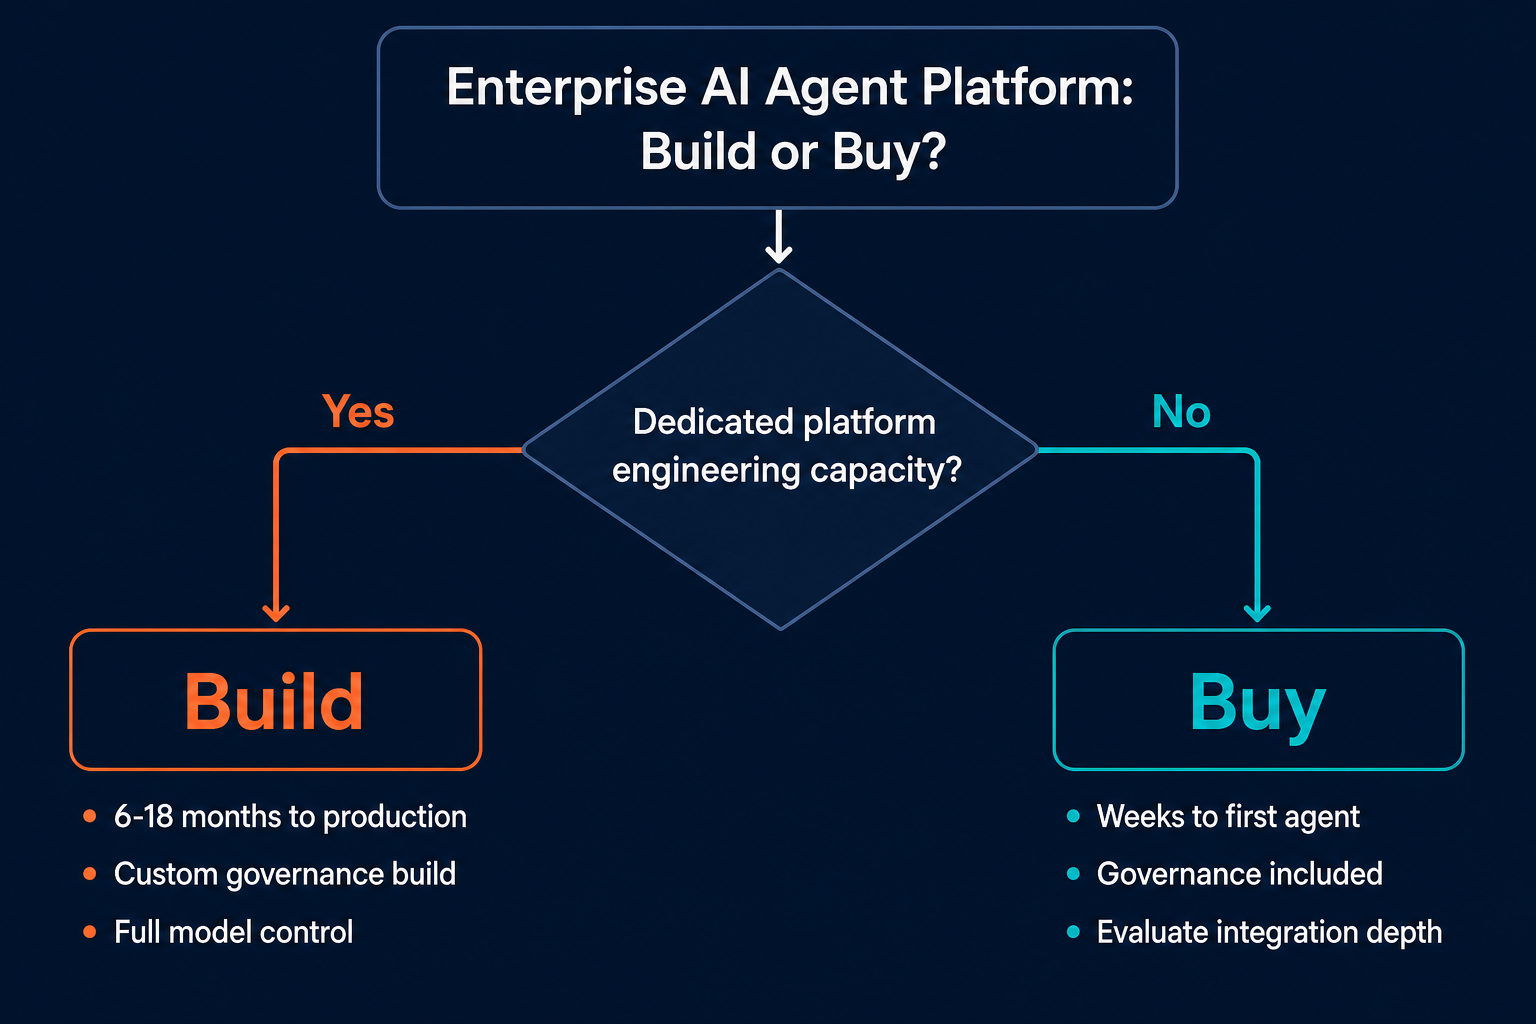
| Criterion | Build | Buy |
|---|---|---|
| Internal platform engineering capacity | High, can staff it long-term | Low or redirected to product |
| Time to first agent in production | 6 to 18 months | Weeks |
| Governance layer | Custom engineering required | Included in platform |
| Model flexibility requirement | Full control over implementation | Vendor-dependent; evaluate before committing |
| Compliance and audit requirements | Custom audit trail build | Look for native controls at your compliance tier |
| Long-term maintenance ownership | Your team | Vendor |
| Stack integration depth | Custom connectors | Evaluate breadth against your actual stack |
The build path is not faster in the short term. It is not cheaper in the medium term. It is defensible only when control requirements cannot be met by an available platform, which for most B2B SaaS organizations evaluating enterprise AI automation is rarely the case.
Three phases of enterprise rollout
The failure mode in enterprise agent rollouts is not the agent failing in production. It is deploying agents before the observability and governance infrastructure is in place to detect and respond to failures. The three-phase model below sequences the rollout to prevent that.
Phase 1: Contained pilot
One team. One workflow. Full observability configured before the agent runs its first task. The workflow should be non-critical and high-frequency: PR notification routing, deployment status reporting, or ticket tagging are common choices. The goal of Phase 1 is not to prove that the agent produces good output. It is to establish baseline reliability metrics and validate that the observability model surfaces failures correctly.
Human checkpoints on every consequential action during Phase 1, regardless of the expected error rate. The checkpoint is not there because the agent cannot be trusted. It is there to establish what the failure profile actually looks like before calibrating oversight. For teams getting started with AI agents, the supervised phase is the investment that makes all subsequent phases safer.
Phase 2: Governed expansion
RBAC and audit logs enabled before any expansion beyond the pilot team. Per-agent tool permissions defined explicitly in the tool registry, not inherited from a global default. The human checkpoint model shifts from "on every action" to "on high-risk actions only," based on the baseline established in Phase 1.
"Most operators get the calibration wrong in one of two directions: they gate every step and call it governance, or they gate nothing and call it efficiency, and both failures look fine until the pipeline breaks at the worst possible moment."
Pazi Blog, Human-in-the-Loop AI Automation
The shift in calibrated human-in-the-loop checkpoints is the key governance decision in Phase 2. Over-gating at this stage defeats the efficiency case for the agent layer. Under-gating without Phase 1 data is operationally irresponsible. Phase 1 baseline metrics are what make the calibration decision defensible rather than arbitrary.
A second workflow or team is added in Phase 2 only after Phase 1 metrics, task completion rate, silent failure rate, and time-to-resolution on checkpoints, are stable. Not after Phase 1 is declared "successful" by team sentiment, but after the numbers are consistent.
Phase 3: Platform-level deployment
Multi-team, multi-workflow. Model flexibility tested against at least two LLM providers before locking in a default. Integration depth expanded to cover the full stack relevant to each team: Slack, GitHub, Jira, Sentry, Linear, PostHog, and Intercom operating simultaneously across different agents with different permission scopes.
At this phase, an internal agent governance runbook is required: how decisions are escalated, how failed runs are reviewed, how permission changes are authorized, and how agents are retired when they are no longer needed. The runbook is the operational documentation that makes the agent layer auditable by security and compliance teams, not just by the engineering team that built it.
What success looks like: metrics that matter
The metrics for an enterprise AI agent platform divide into two categories: performance metrics, measuring whether the agent completes the intended task, and governance metrics, measuring whether the agent operates within its defined boundaries. Both are required. A platform with strong performance metrics and weak governance metrics is not enterprise-ready.
1. Task completion rate. The percentage of agent runs that complete the target task without human intervention. Baseline this against the pre-agent manual completion rate to establish the actual productivity delta, not just the absolute number.
2. Silent failure rate. The percentage of runs that report success but did not complete the user-facing deliverable. This metric is separate from the raw error rate. A run that errors visibly is detectable and recoverable. A run that completes its internal steps but fails on the final delivery, the Slack notification, the ticket update, the report distribution, is invisible without explicit instrumentation.
The silent failure rate metric catches exactly what happened in Pazi's own production: a bug-triage cron that completed GitHub issue creation and Jira ticket updates but ran out of budget before the Slack announce step, and reported "delivered." The metric surfaced it; the platform's log detail explained it. For a full account: AI agent observability: 5 silent failure modes in production.
3. Time-to-resolution on gated workflows. How long human checkpoint decisions take. If HITL calibration is correct, this metric should not trend upward as agent volume scales. If it does, the checkpoint model is miscalibrated, likely over-gating, and needs adjustment.
4. Agent cost per task. Model inference and tool call costs per completed task. Compare against the human equivalent time cost to establish the efficiency case for continued investment, and to identify workflows where the agent is more expensive than the alternative.
5. RBAC compliance rate. The percentage of tool calls that fall within the agent's defined permission boundary. This should be 100%. A rate below 100% means the tool registry is misconfigured or an agent has been granted broader permissions than its actual workflow requires. Both are security findings.
6. Audit log coverage. The percentage of runs with full trace coverage. Should be 100%. Gaps in coverage are governance exposure: runs that terminated abnormally before the logging step completed, which is itself a finding worth investigating.
An enterprise AI agent platform is an infrastructure decision, not a tooling decision. The governance layer, observability, RBAC, audit logging, human checkpoint configuration, model flexibility, is the product. The agents that run on top of it are the application layer. Organizations that evaluate agent tools without evaluating the governance infrastructure are making the same mistake as evaluating a database by its query results without asking about backup, replication, or access control.
The evaluation framework in this guide, five architecture layers, seven vendor questions, a three-phase rollout, and six governance metrics, is designed to make that evaluation concrete. The questions have specific answers. The phases have specific success criteria. The metrics are observable from day one.
Pazi provides the orchestration, observability, RBAC, and integration depth described in this guide without the custom build. For teams beginning that evaluation, it is a practical starting point.
Related reading: