
The founder opens three tabs before breakfast. Meta says the campaign is profitable, GA4 reports a different revenue figure, and the store platform shows orders that neither report seems to explain. Traffic looks healthy, yet checkout completion has slipped. A dashboard full of charts has created more arguments than answers.
An ecommerce analytics dashboard should solve that problem, but only if it connects spend, shopper behavior, orders, and post-purchase economics. A polished interface can still mislead when attribution rules are hidden, checkout events are missing, or returns never reach the profitability view. The useful question isn't “How many metrics can the dashboard display?” It's “Which decision can this number support, and how reliable is the evidence behind it?”
Table of Contents
- Why Every Store Owner Needs a Single View of Performance
- What an Ecommerce Analytics Dashboard Actually Is
- Core Metrics and KPIs Your Dashboard Must Show
- Modeling Checkout as a Funnel, Not a Single Conversion Rate
- Attribution Is a Model, Not a Fact
- Returns and Post-Purchase Profitability
- How to Evaluate and Use a Dashboard as a Founder
Why Every Store Owner Needs a Single View of Performance
At 8 a.m., the paid media dashboard says scale. By 8:15, the store platform shows softer revenue than expected. Before 9, support flags a spike in failed payments and refund requests. If those numbers live in separate tools, the founder is forced to guess which one deserves trust before making a budget call.
That is the cost of disconnected reporting. It slows decisions, but worse, it creates confident decisions from partial evidence.
The marketer can show low acquisition costs and ask for more spend. The operator can point to cancellations, returns, and ticket volume. Finance sees cash going out faster than margin is coming back. None of them is necessarily wrong. They are just looking at different slices of the business, each with its own definitions, delays, and blind spots.
The cost of disconnected reporting
I have seen stores increase budget because platform reporting looked strong, then discover later that checkout tracking was broken, attribution rules were overstating paid performance, or post-purchase losses erased the apparent gain. A single top-line revenue number does not protect you from any of that. It can hide where demand came from, where conversion dropped, and whether the order stayed profitable after discounts, shipping, and returns.
A single view matters because it forces those signals into the same frame. You can compare spend against sessions, sessions against product interest, product interest against checkout progress, and orders against what survived after the sale. Once those relationships are visible, a founder can tell the difference between a traffic problem, a merchandising problem, a checkout problem, and a measurement problem.
Practical rule: A dashboard earns its place when it ties a decision to the behavior, costs, and measurement rules behind the headline metric.
What a single view should reveal
A useful view should answer a few plain questions. Did the right traffic arrive. Did shoppers reach the right products. Did checkout complete at the expected rate. Did the order remain profitable after refunds and service costs. Did that customer come back.
It should also show the conditions behind the numbers. Attribution settings matter because channel credit is a model you choose, not a fact handed down by the platform. Consent coverage matters because missing users can distort trend lines. Refresh timing matters because stale data often looks like a performance drop. Missing events matter because a clean chart can still be built on broken tracking.
That is when a dashboard becomes operational. It stops being a wall of charts and starts becoming a test of whether the business is healthy enough to act on what it sees.
What an Ecommerce Analytics Dashboard Actually Is
An ecommerce analytics dashboard is less like a spreadsheet and more like a cockpit instrument panel. A pilot doesn't inspect every sensor separately before responding to an altitude change. The panel brings the relevant signals together, shows their current state, and helps the pilot decide what needs attention.
A store dashboard should do the same with orders, acquisition, website behavior, customer value, and operational outcomes. It isn't merely a collection of charts copied from Shopify, GA4, Meta Ads, an email platform, and a returns system. It joins those signals around a common question, such as whether a campaign is creating profitable customers or generating expensive traffic.
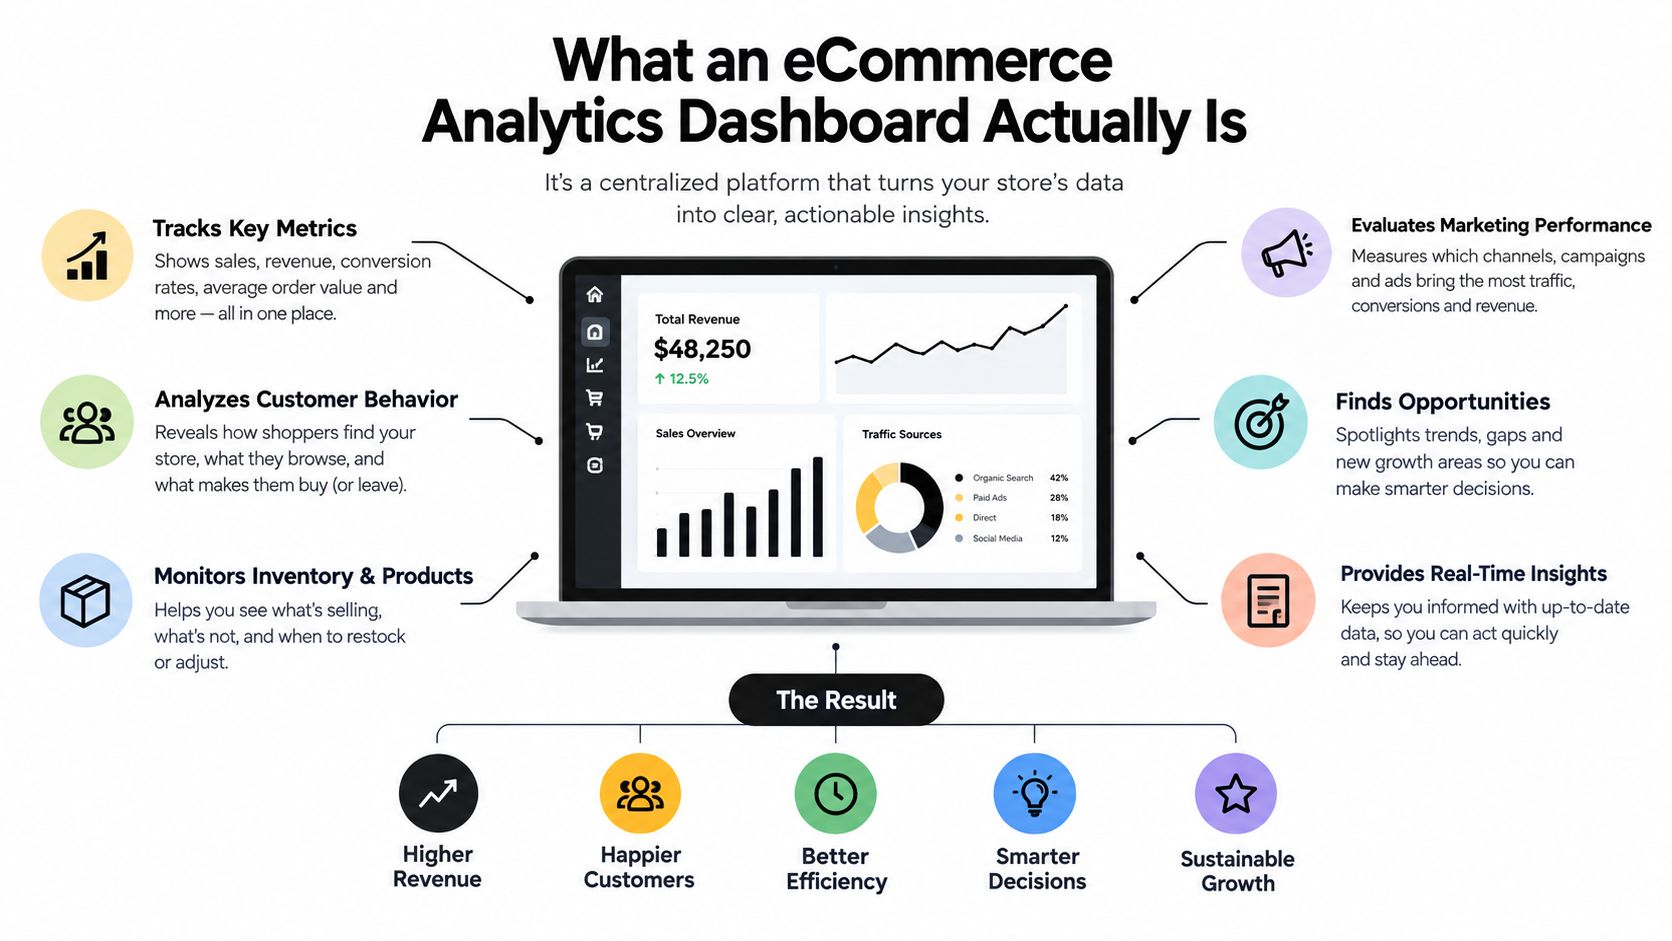
A report tells the owner what one system recorded. A dashboard helps the owner compare connected signals before choosing an action.
From isolated widgets to connected decisions
A raw report might show revenue by day. Another might show clicks by campaign. A third might show product views. The dashboard becomes useful when those records share consistent dates, customer or session logic, event definitions, and channel labels. Without that foundation, visual unification only hides disagreement behind a cleaner interface.
A mature view usually combines:
- Acquisition: paid search, paid social, organic traffic, email, referrals, and other declared sources.
- On-site behavior: landing pages, product views, cart events, checkout steps, payment attempts, and completed orders.
- Commercial outcomes: gross sales, refunds, discounts, shipping, fees, contribution margin, and repeat purchases.
- Operational context: inventory availability, fulfillment signals, return reasons, and customer support burden.
The dashboard shouldn't display every available event. Each tile needs an owner, a definition, a refresh expectation, and a decision attached to it. If no one knows what action follows a change, the metric is decoration.
For operators working across marketplaces, a unified Amazon data dashboard can provide a useful model for consolidating performance signals instead of forcing the owner to assemble marketplace data manually. The same principle applies to a direct-to-consumer store, even when the underlying sources differ.
Core Metrics and KPIs Your Dashboard Must Show
A dashboard earns its keep when it helps you answer one blunt question. Is the store getting profitable demand, turning that demand into completed orders, and bringing enough of those customers back to justify what you spent to get them?
That is why I group core metrics into acquisition, conversion, and retention. The split is practical, not academic. It stops founders from treating revenue as proof that the system works when revenue can rise at the same time margins, checkout completion, or repeat behavior get worse.
A revenue-only view hides too much. A ROAS-only view can be worse, because platform-reported credit changes with attribution settings and often ignores returns, fees, and what happens after the first order. If a number can move because you changed a reporting rule, treat it as a model to inspect, not a fact to trust on sight.
Acquisition metrics explain the quality of incoming demand
Start with traffic by source. It shows where visits come from and gives context for every downstream number. Then look at customer acquisition cost, or CAC, which ties spend to newly acquired customers. ROAS belongs here too, but only as a directional efficiency metric. It compares attributed revenue with ad spend. It does not tell you whether the order was profitable after discounts, shipping, payment costs, or later refunds.
Segment these metrics on purpose. A blended average hides the underlying story. Paid social can create first-purchase volume while email converts people who already know the brand. Organic search may introduce higher-intent category traffic, but with a longer path to purchase. Geography, customer type, and channel splits matter for the same reason. Stores do not grow through one uniform stream of demand.
Conversion metrics locate the commercial bottleneck
Conversion rate stays on the dashboard because it is useful shorthand. It becomes operational only when it sits beside product views, cart creation, checkout initiation, payment attempts, and completed orders. Without those supporting events, a falling conversion rate tells you something is wrong but not where the failure starts.
Average order value helps you judge merchandising, pricing, and bundle strategy. Funnel completion helps you see whether demand weakens on the product page, in cart, or during payment. Here, many dashboards drift into fiction. If checkout steps are under-instrumented, teams blame traffic quality for a payment issue, or blame checkout for a stock problem. The metric is only as trustworthy as the event design behind it.
Retention metrics test whether growth lasts
Repeat purchase rate and customer lifetime value keep acquisition from being judged too early. A channel that wins cheap first orders may still underperform if those customers never come back. Another source may look expensive on day one and still be better business because its buyers reorder, return less, or buy higher-margin products over time.
Use retention metrics carefully. Cohort comparisons, customer-type splits, and product-group views are useful only when the store has enough clean history to support them. Otherwise the dashboard creates precision you have not earned yet.
| KPI | Question It Answers | Decision It Supports |
|---|---|---|
| Traffic by source | Where are visitors coming from? | Choose which channels need investigation or investment |
| CAC | What does acquiring a new customer cost? | Set or review acquisition spending limits |
| ROAS | How much attributed revenue does advertising receive? | Compare campaign efficiency, with attribution caveats |
| Conversion rate | How effectively does traffic become an order? | Investigate traffic quality, merchandising, or experience |
| Average order value | What does each completed order contribute before costs? | Test bundles, pricing, and upsells |
| Funnel completion | At which step does intent weaken? | Prioritize product, cart, checkout, or payment fixes |
| Repeat purchase rate | Do customers return? | Evaluate retention and post-purchase programs |
| Customer lifetime value | What value may a customer create over time? | Compare acquisition investment with longer-term economics |
Operators who want a wider checklist can review key Shopify performance metrics. Then cut aggressively. The best dashboard is usually smaller than the source report, because every metric on it should be trusted enough to drive a real decision.
Modeling Checkout as a Funnel, Not a Single Conversion Rate
A checkout is a sequence of decisions and technical events. A reliable implementation joins sessions to product views, cart creation, checkout initiation, payment attempts, and completed orders using stable event IDs. Purchase events should be deduplicated server-side so retries, refreshes, and client-side tracking failures don't create false orders.
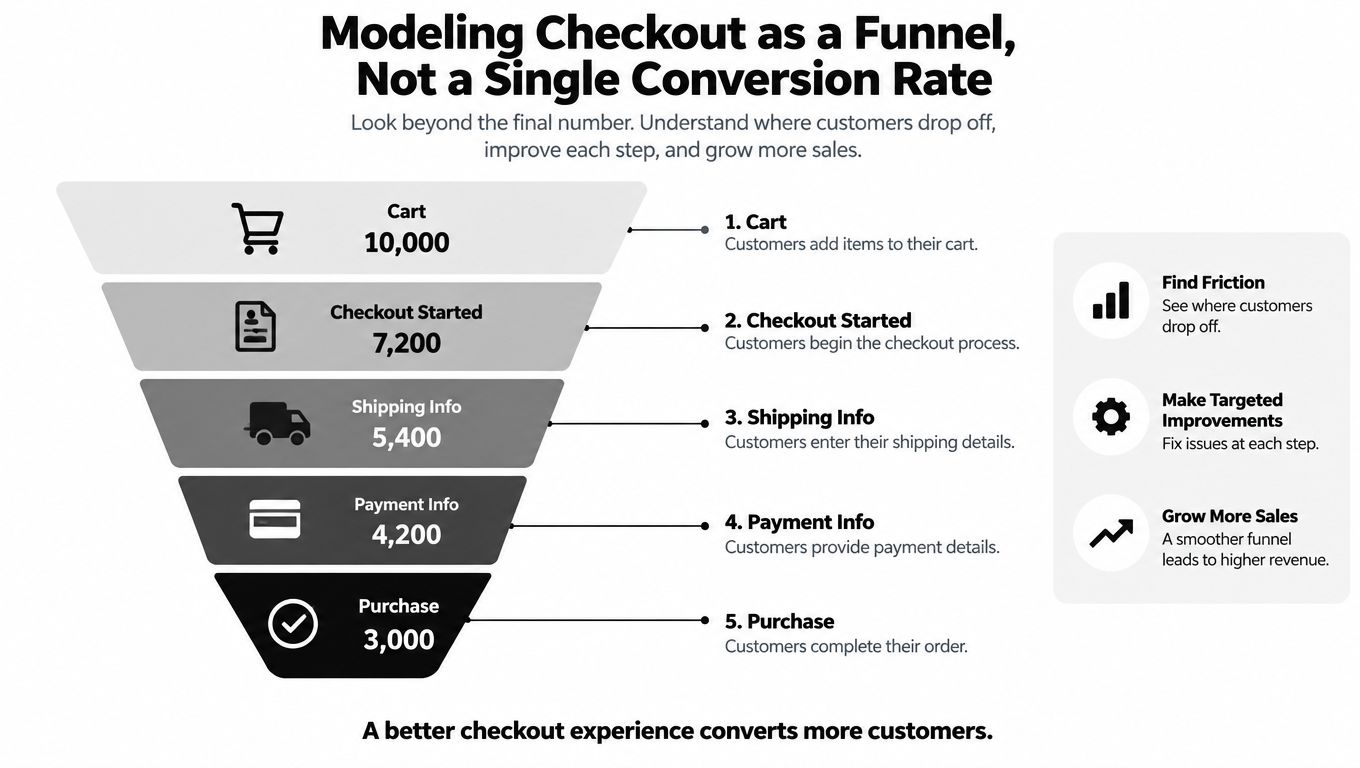
An aggregate conversion rate hides the location and cause of loss. Baymard's global meta-analysis places average cart abandonment at approximately 70.19%, and its research found that 17% of US online shoppers reported abandoning an order because checkout was too long or complicated. That doesn't mean every abandoned cart reflects a checkout defect.
Separate intent from friction
Baymard's compilation of 50 published studies reports an average documented cart-abandonment rate of 70.22%, while 42% of US online shoppers said they abandoned because they were browsing or not ready to buy. The figures are benchmarks, not store-specific targets. They show why a dashboard must distinguish early browsing behavior from a failure after payment intent has been established.
Useful segments include:
- Device: A mobile-only decline after address entry suggests form layout, keyboard, or validation problems.
- Country: A country-specific drop may point to shipping coverage, local payment expectations, or currency clarity.
- Payment method: A collapse around one method warrants a review of provider responses and decline handling.
- Traffic source: A channel with high cart creation but weak checkout completion may be sending poorly qualified or misled visitors.
- Checkout stage: A fall after shipping costs appear raises a price-transparency question, while a fall at payment attempt suggests technical failure.
Baymard's checkout research identifies checkout design and flow as a possible independent cause of abandonment. Its benchmark research covered 344 major US and European ecommerce sites and reported that only 2% had a “good” checkout flow. Those findings support step-level instrumentation, but they don't justify assuming design is the cause in every store.
Turn the dashboard into an alert system
An operational dashboard can alert the owner when a segment's checkout-start-to-purchase rate falls materially below its trailing baseline. The alert should then place nearby evidence beside the change, including form errors, page latency, payment declines, and shipping-cost exposure.
A useful alert doesn't say “conversion is down.” It says that mobile checkout completion weakened after a release, or that one payment method is failing while others remain stable. That wording shortens the path from observation to diagnosis and prevents the common response of discounting everyone to compensate for a problem affecting one step.
Attribution Is a Model, Not a Fact
Channel revenue isn't an objective property attached permanently to an order. Attribution assigns credit for a key event to touchpoints on the customer's path, so the reported answer depends on the rules used.
Google Analytics 4 describes attribution as assigning credit to ads, clicks, and other factors that contribute to important user actions. GA4 can break results out by Default channel group and show key events and revenue under the selected model. Switching between data-driven attribution, paid-and-organic last click, and Google-paid-channels last click can change the credited events and revenue for the same period.
Preserve the rules beside the result
GA4 attribution has three operational settings that belong in the dashboard context:
- Reporting attribution model: The rule or algorithm that assigns credit.
- Eligible channels: The touchpoints allowed to receive credit.
- Key-event lookback window: The period in which earlier interactions can qualify.
Google's GA4 documentation states that these settings are managed in the property's Admin area under Data display and Events, and that a user needs the Marketer role or above to change them. Two reports can therefore show different revenue totals for the same dates without either report containing a calculation error.
GA4 also excludes direct visits from attribution credit unless the entire path consists of direct visits. That rule alone can make a channel comparison look different from a platform report that uses another path definition.
Decision rule: A channel number without its attribution model, eligible channels, and lookback window is incomplete evidence.
Show confidence instead of false precision
Small merchants face an additional problem. Consent loss, browser restrictions, modeled conversions, and conflicting platform reports make click-level attribution less dependable. A more advanced dashboard may be less precise at the individual-customer level while producing more defensible budget decisions.
The reliability layer should show:
- consent rate and measurement coverage;
- modeled versus observed conversions;
- disagreement between platform-reported results;
- blended CAC alongside channel-reported CAC;
- whether evidence is strong enough to approve more spend.
Server-side tagging, marketing-mix modeling, and incrementality testing can complement click-level reporting, but each has costs and data requirements. Marketing-mix modeling may require 12–24 months of historical spend and outcome data according to the practical industry analysis collected by Zipchat. A founder shouldn't adopt a complex model merely because it sounds more scientific. The dashboard should state what is observed, what is modeled, and what decision the evidence can reasonably support.
Returns and Post-Purchase Profitability
A sale isn't the same as retained revenue. The order may later generate a refund, return shipping, replacement shipment, payment fee, support workload, or discount adjustment. A dashboard that stops at gross sales can reward the campaigns that create the most expensive problems.
A 2025 benchmark covering more than 1,250 European webshops reported an average ecommerce return rate of 23.5%, a 44.5% increase in return volume during the December–February peak period, and an average return-shipping cost of €5.39. The benchmark is specific to its studied webshops, but it illustrates why seasonal reporting must preserve post-purchase outcomes rather than treating every order as complete value. The benchmark details are available from Ringly.

Reconcile the economics after payment
The dashboard should move from gross sales toward contribution margin. That view reconciles:
- Revenue adjustments: refunds, returns, discounts, and replacement orders.
- Variable selling costs: shipping, return shipping, payment fees, and fulfillment.
- Customer burden: support effort and service recovery where it can be measured.
- Commercial origin: cohort, campaign, acquisition source, SKU, product category, and return reason.
ROAS can still be useful as a media-efficiency signal, but it shouldn't be treated as profit. A campaign can receive strong attributed revenue while the acquired orders produce weak retained contribution after returns and operational costs.
Find the expectation gap
Return reasons turn a financial symptom into a product and marketing question. “Product not as expected” may indicate inaccurate imagery, unclear sizing, weak product copy, or creative that promises something the item doesn't deliver. Other categories may carry structural return behavior that isn't easily prevented through better messaging.
The dashboard should separate those cases. If one SKU generates returns because customers misunderstand fit, the response may be improved sizing guidance and imagery. If one acquisition source drives returns for a particular promise, the creative or landing page needs revision. If the pattern reflects the product category rather than a preventable mismatch, the business may need different margin assumptions and targeting.
The useful output isn't “returns are high.” It's “this campaign produces customers whose retained contribution is weak because this product and promise create a recurring expectation gap.” That finding can feed product pages, advertising creative, merchandising, and launch decisions.
How to Evaluate and Use a Dashboard as a Founder
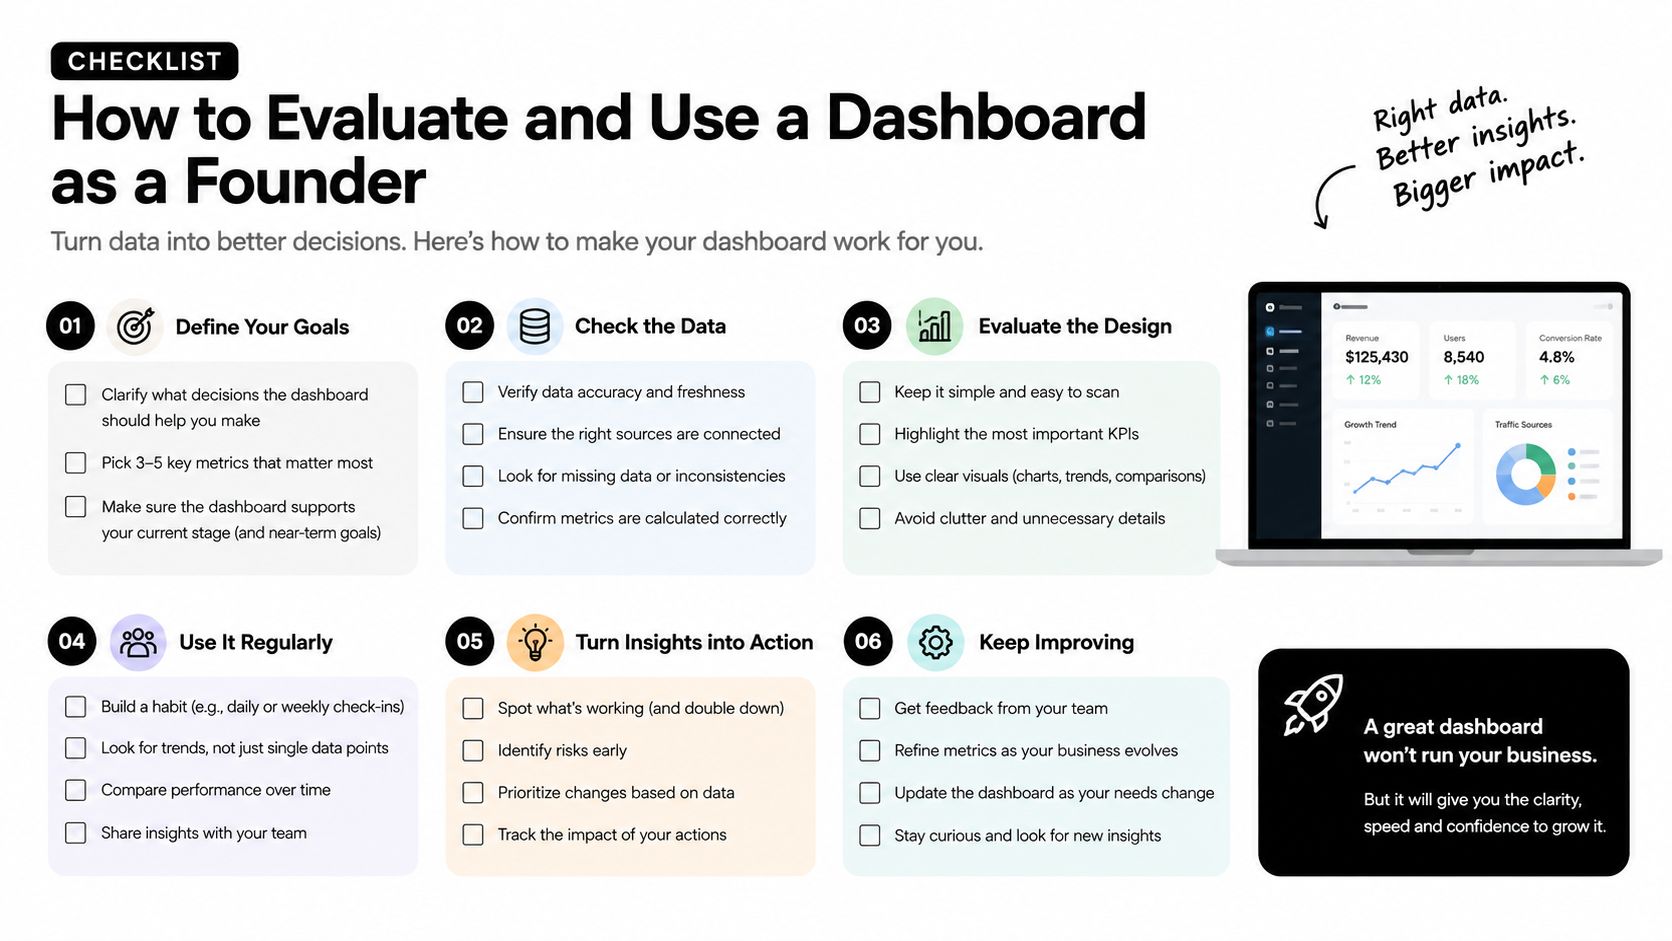
A founder evaluating an ecommerce analytics dashboard should test the decision path, not the visual polish. The tool needs to show how a channel produces on-site behavior, how checkout turns intent into orders, how attribution assigns credit, and how returns alter the economics.
Five tests for reliability
Channel-to-behavior connection comes first. Can the dashboard move from campaign spend to landing page, product view, cart, checkout, and order without manual spreadsheet work?
Funnel instrumentation comes next. Are product views, cart events, checkout steps, payment attempts, and purchases defined consistently? Can the owner isolate device, country, payment method, customer type, and traffic source?
Attribution visibility is essential. Does every channel revenue view show the selected model, eligible channels, and lookback window? Can the owner compare models without mistaking one output for ground truth?
Post-purchase reconciliation separates commercial reporting from vanity reporting. Does the system connect gross sales with refunds, shipping, fees, discounts, replacement orders, and return reasons?
Reliability language completes the test. Does the dashboard show measurement coverage, consent limitations, modeled conversions, disagreement, and approval thresholds in plain English?
A founder should also match the refresh cadence to the decision. Sales and spend may need close monitoring, while retention and lifetime value require a longer observation window. Trend views and period comparisons are more useful than a single snapshot, especially because UNCTAD's ecommerce data shows why historical baselines matter when online retail adoption changes over time.
A practical founder checklist
- Define ownership: Assign a person to investigate each alert and approve the resulting action.
- Record assumptions: Store metric definitions, attribution settings, refresh timing, and known data gaps beside the charts.
- Review segments: Compare device, market, channel, product, and new-versus-returning customer results before changing budgets.
- Inspect behavior: Use privacy-protected session recordings to add context to a diagnosed issue, not to replace event data.
- Set approval gates: Require human approval before increased spend, major discounts, or campaign launches.
- Close the loop: Feed return reasons, failed payments, and support patterns back into copy, creative, product pages, and offers.
Pazi can serve as one option for founders who want a unified workspace connecting paid ads, organic traffic, email, social, website activity, and privacy-protected session recordings. Its Business Pulse view also keeps projects, opportunities, tasks, calendars, and status in one workspace, with human approval controls around spend and key launches.
The same-day test is straightforward. Choose one acquisition channel, trace it through the checkout funnel, attach the relevant attribution context, and reconcile its orders against returns and variable costs. If the dashboard can't explain what the number means, what it omits, and which action it supports, the store doesn't yet have a reliable performance system.
Pazi brings paid ads, organic traffic, email, social, website activity, and privacy-protected session recordings into one owner-controlled workspace, so an ecommerce analytics dashboard can connect acquisition with behavior and outcomes. Visit Pazi to see how its Business Pulse workflow can help turn fragmented store data into reviewed, actionable decisions.